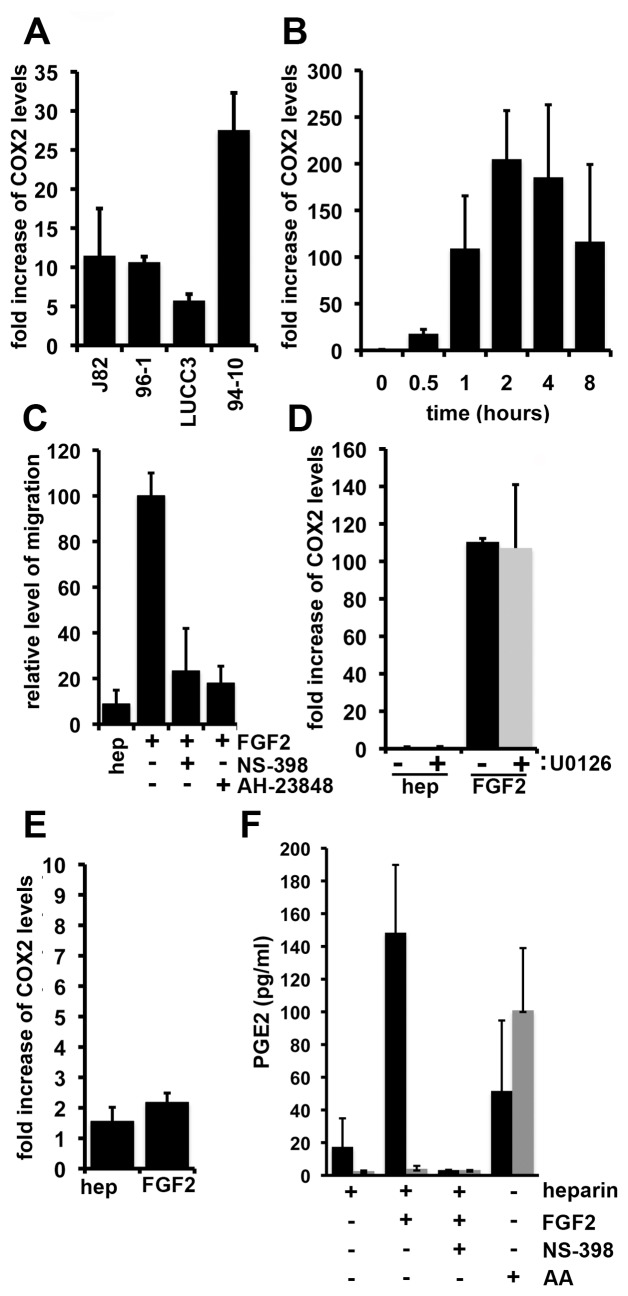
Figure 6. FGFR1 induces expression of COX-2.
A. Real time RT-PCR for COX-2 on cell lines expressing ectopic FGFR1 cultured with heparin and FGF2 for 24 h. Values were standardised to cells cultured with heparin alone and represent fold increase compared to controls. B. Real-time RT-PCR for COX-2 in 94-10-FR1 cells cultured with heparin and FGF2 for the indicated time points. Results are represented as fold change compared to untreated cells. C. Transwell assays comparing the effects of COX-2 and EP4 inhibitors on FGFR1-induced migration. Values represent relative percentage of migrated cells (as measured by DAPI stain) compared to 94-10-FR1 cells cultured with heparin and FGF2. D. Real time RT-PCR for COX-2 in 94-10-FR1 cells cultured with heparin or heparin and FGF2 for 1 h. Cells were pre-treated for 1h with and without U0126 and results are represented as a fold-change compared to heparin alone. E. Real-time RT-PCR for COX-2 expression in 94-10-Y766F cells cultured with heparin and FGF2 for 1 h. All real time RT-PCR experiments were normalised to SDHA. F. PGE2 levels were measured by an enzyme immunoassay in lysates (black bars) and media (gray bars) from cells cultured with heparin; heparin and FGF2; heparin, FGF and NS-398; or arichidonic acid (AA) for 4 h.

