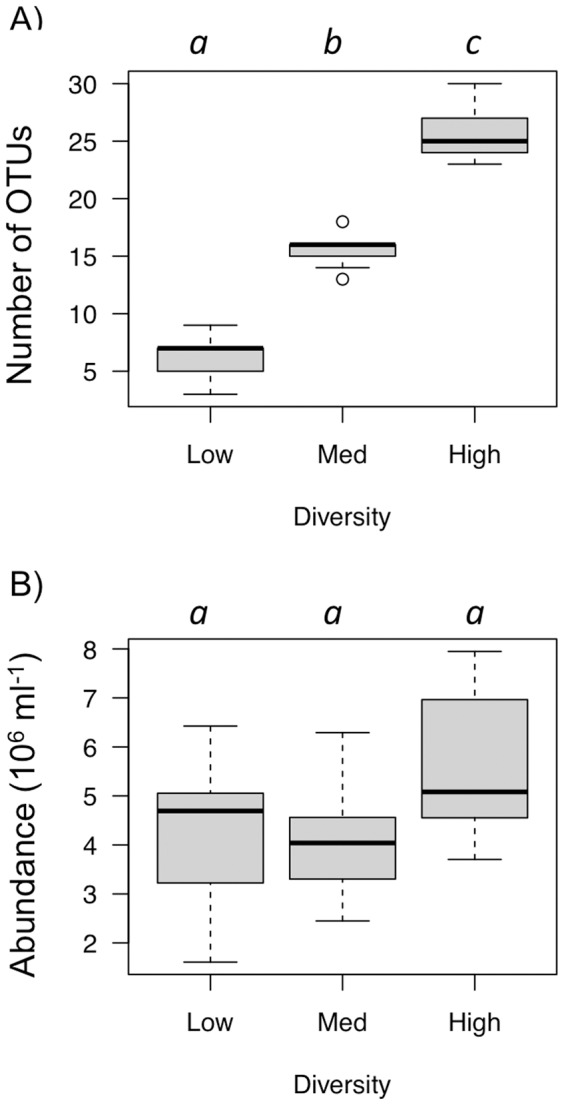
Figure 2. Preliminary tests results for initial bacterial diversity gradient and abundances.

(A) Number of operational taxonomic units (OTUs) for the three bacterial diversity levels after the acclimation period (48 h of incubation in Thau lagoon water, Fig. 1C). Per diversity level, the three immigration treatments are combined (no immigration, 1% and 10% of immigration, n = 9). Dilution rates are: low = 10−5, Med = 10−3 and High = no dilution (see methods). (B) Bacterial abundance after the acclimation period for the three diversity treatments. The three immigration treatments are combined per diversity level. Diversity levels connected by the same letter are not significantly different (Tukey-Kramer test, p<0.05).
