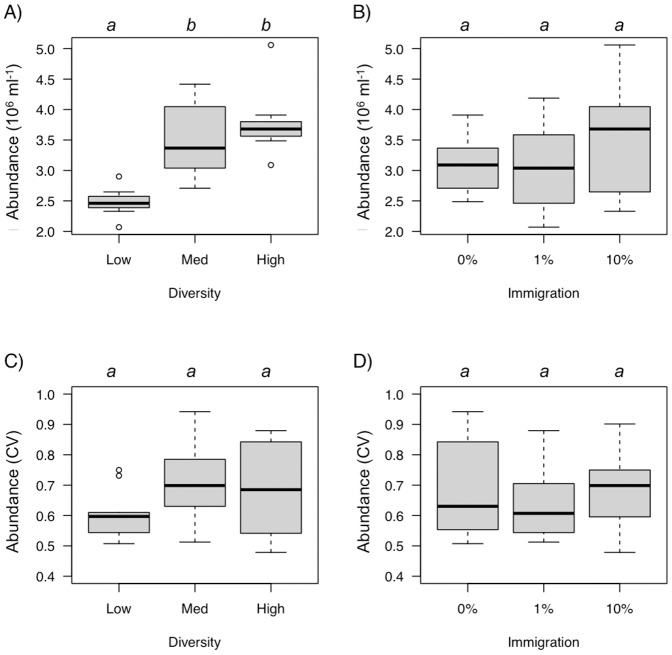
Figure 4. The effect of diversity (A) and immigration (B) on global temporal mean bacterial abundance during the experiment (from 48 h to 240 h of incubation), and the effect of diversity (C) and immigration (D) on the temporal coefficient of variation (CV) for bacterial abundance.
Diversity or immigration levels connected by the same letter are not significantly different (Tukey-Kramer test, p<0.05).

