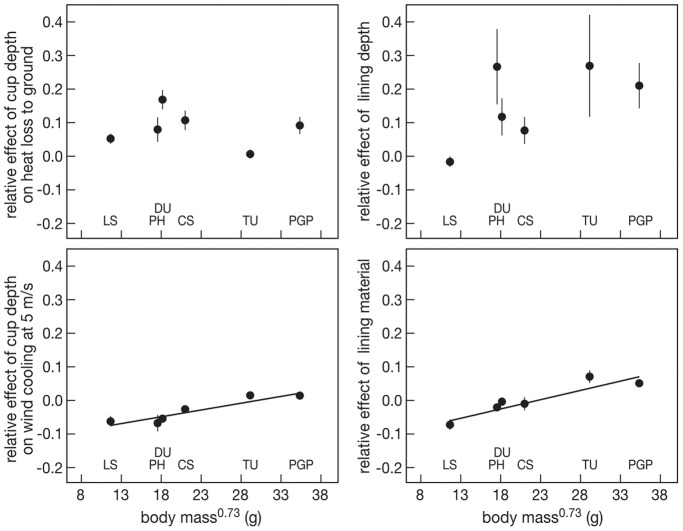
Figure 7. The relative contribution of cup depth on heat loss to the ground (upper left), of cup depth on wind cooling at 5 m/s (lower left), of lining depth (upper right)and of lining material (lower right) on egg cooling rates in relation to body mass.
LS = little stint, PH = red phalarope, DU = dunlin, CS = curlew sandpiper, TU = turnstone, PGP = Pacific golden plover. Average and se values are represented for each species. The lines represent the regression lines.

