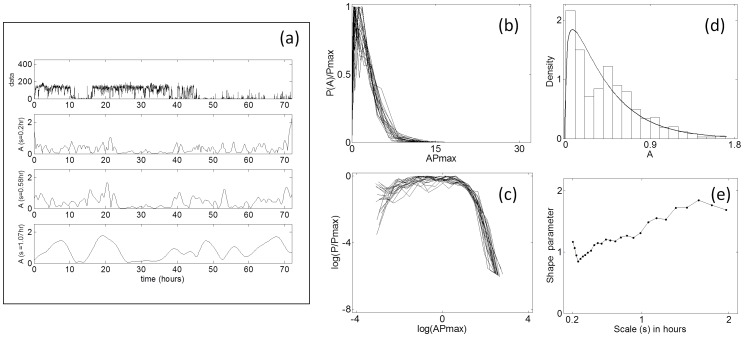
Figure 1. Characterization of multi-scale amplitude of motility data by wavelet analysis from a representative subject with major depression.
(a) Raw data in arbitrary units (a.u), with amplitudes of rhythms detected at three time-scales. Subject shows a disrupted activity profile due to disturbed sleep/wake cycle which is common in depressed subjects. (b) Rescaled probability distribution of amplitude obtained by rescaling using Pmax to provide unit area of amplitude at a range of time-scales up to 2 hours. (c) The same data, log-transformed and showing a long-tail, which share most of the values of log (APmax). (d) Gamma-distribution function fit of the amplitude distribution at a scale of 0.58 hours. The goodness-of-fit is determined by Akaike information criteria in comparison with other distributions (20). (e) The shape parameter obtained from the Gamma-function fit decreases at short time-scales and increases at long time-scales. VI is obtained by finding the area under the curve.

