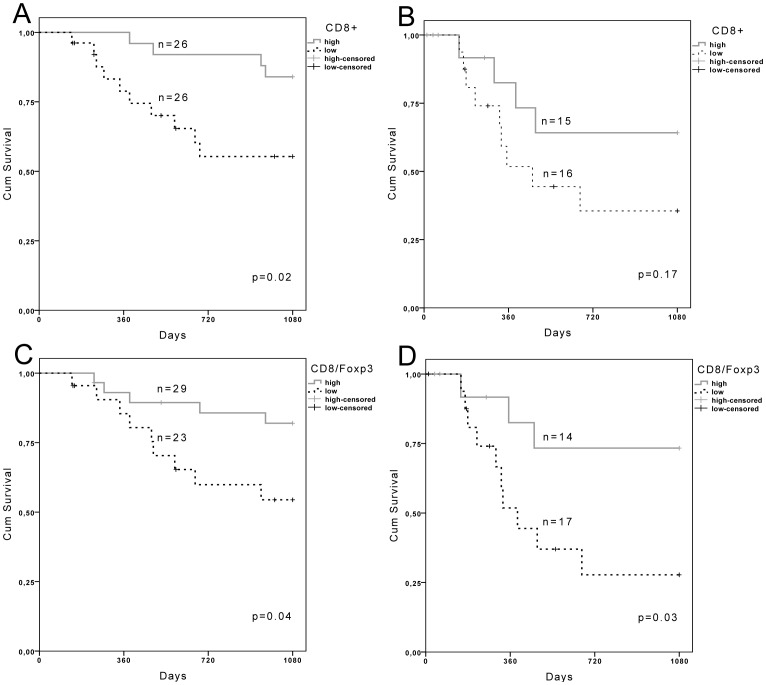
Figure 3. Kaplan-Meier curves showing disease free patient survival depending on TSCC HPV status and TILs, and n denotes the number of patients in each stratified group.
A) HPV+TSCC and B) HPV−TSCC patients stratified by the number of CD8+ TILs. High and low denotes CD8+ TIL count above and below the median values of 33 for HPV+TSCC and 4.4 HPV−TSCC. C) HPV+TSCC and D) HPV−TSCC patients stratified by the ratio of CD8+/FoxP3+ cell ratio. High and low denotes CD8+/FoxP3+ cell ratio above and below 1.

