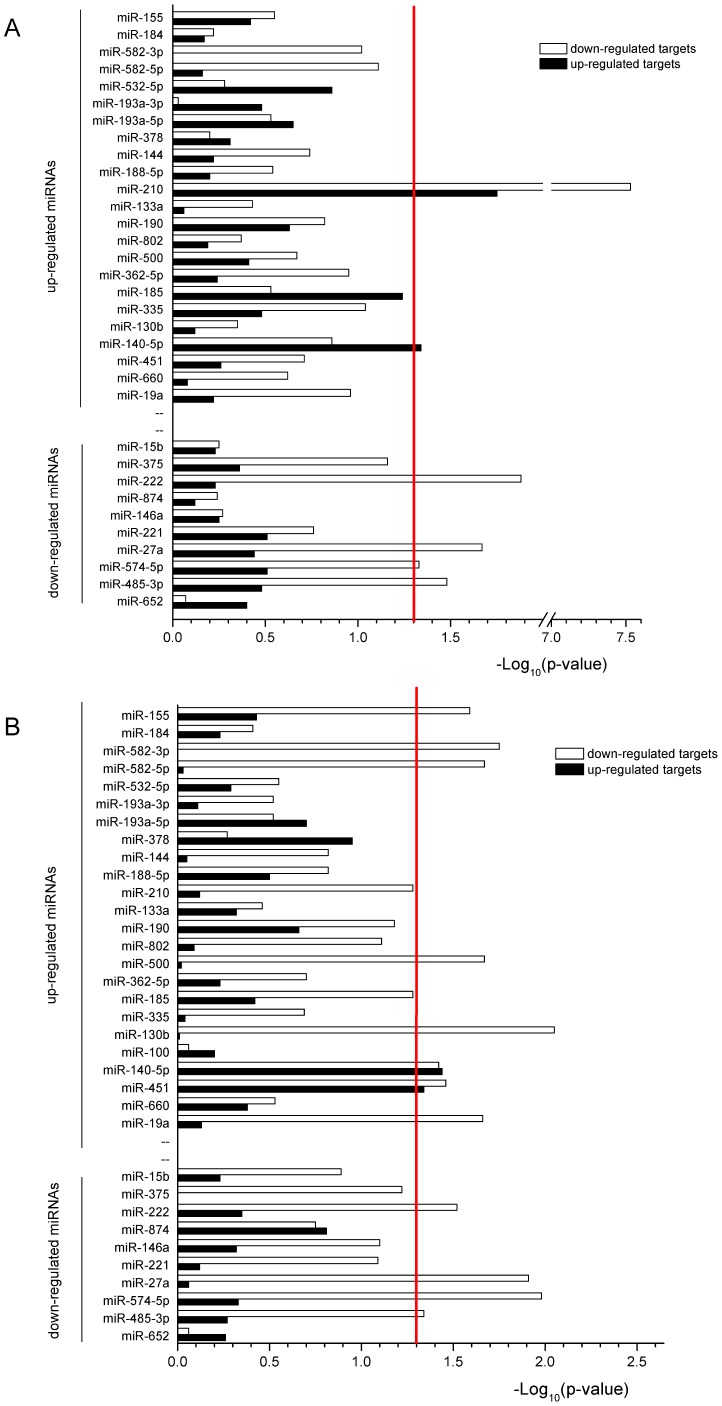
Figure 3. The targets of each individual DEM included in the lists of DEGs.
(A) DEGs with FDR <5%; (B) DEGs with FDR <10%. A two-tailed Fisher’s Exact Test was used to determine the significance (p<0.05, above red line at 1.3). The negative log of the p-value is plotted on the x-axis for both down-regulated mRNAs (white) and up-regulated genes (black).

