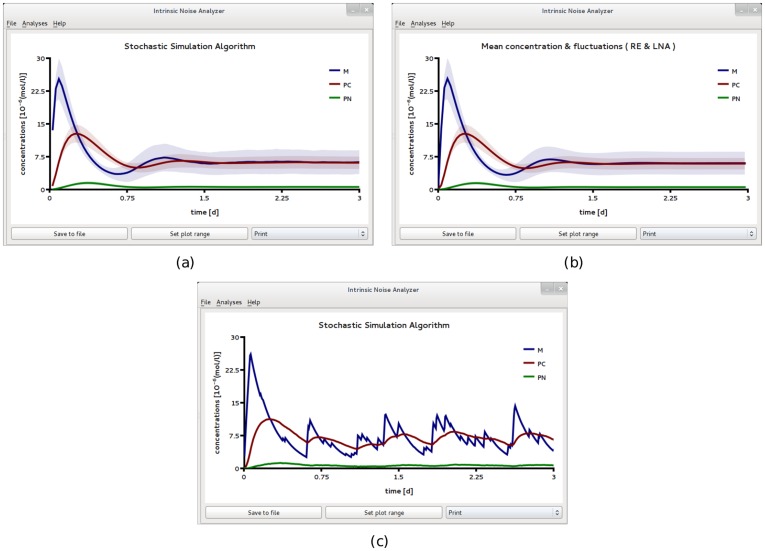
Figure 6. A circadian clock model realized in a large compartment of volume  .
.
(a) Mean concentrations and variance of fluctuations obtained by ensemble averaging 3,000 stochastic realizations. This corresponds to averages calculated over a population of an equal number of uncoupled identical cells, each having a circadian clock inside. The latter time course is well reproduced by the Linear Noise Approximation shown in (b). While the population level concentrations display damped oscillations, individual stochastic simulation realizations (which correspond to individual cell data) reveal no obvious periodicities, (c). All figures have been obtained by analyzing SBML file F5 with iNA.

