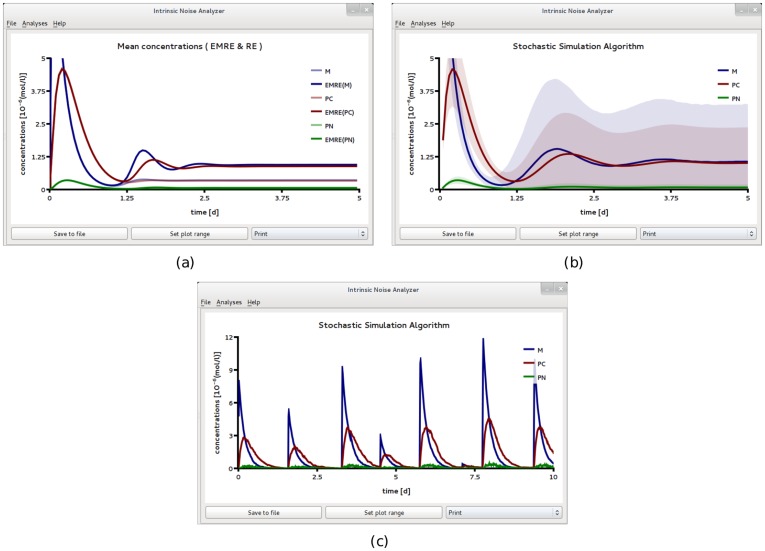
Figure 9. A circadian clock model realized in a small compartment of volume  and with strong negative feedback.
This rate constant k 1 which controls the strength of transcriptional repression is made a hundred times larger than that used for Fig. 8. In (a) we compare the predictions of the REs with those of the EMREs. The EMREs predict damped oscillations at the population level which are missed by the REs. The presence of these noise-induced synchronous oscillations is qualitatively confirmed by stochastic simulations of 100,000 independent cells (b). However, the phase of the damped oscillation is quantitatively different from the EMREs. In particular, panel (a) shows damped oscillations with a period of about 1 day (d) while the ones obtained from stochastic simulations in panel (b) have a significantly longer period. We have also carried out stochastic simulations at the single cell level (c) which show sustained bursty oscillations with a period of about 1.5 days in the mRNA, M, and cytosolic protein, Pc, concentrations. All figures have been obtained by analyzing SBML file F7 with iNA.

