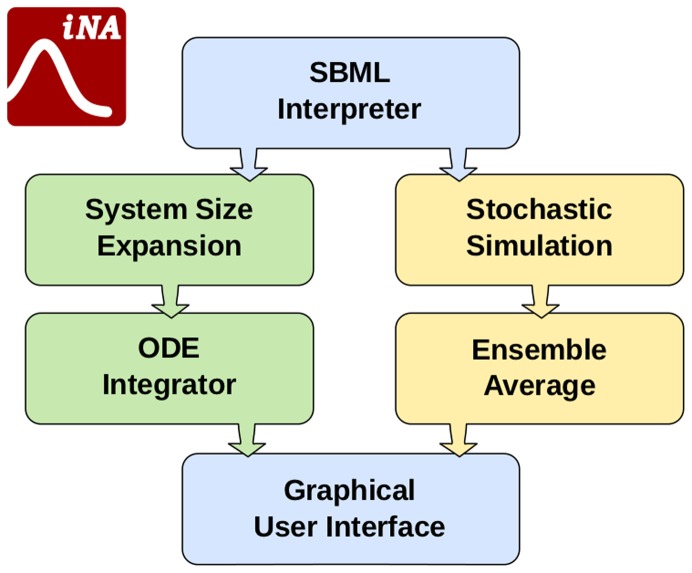
Figure 10. Schematic illustrating the architecture of the software iNA.
The software reads an SBML file, sets up an internal mathematical representation of the biochemical reaction scheme, and computes the mean concentrations and the variances and covariance of concentration fluctuations as a function of time by stochastic simulations and by approximations based on the system size expansion. The results are then output via tables and plots implemented in the GUI.

