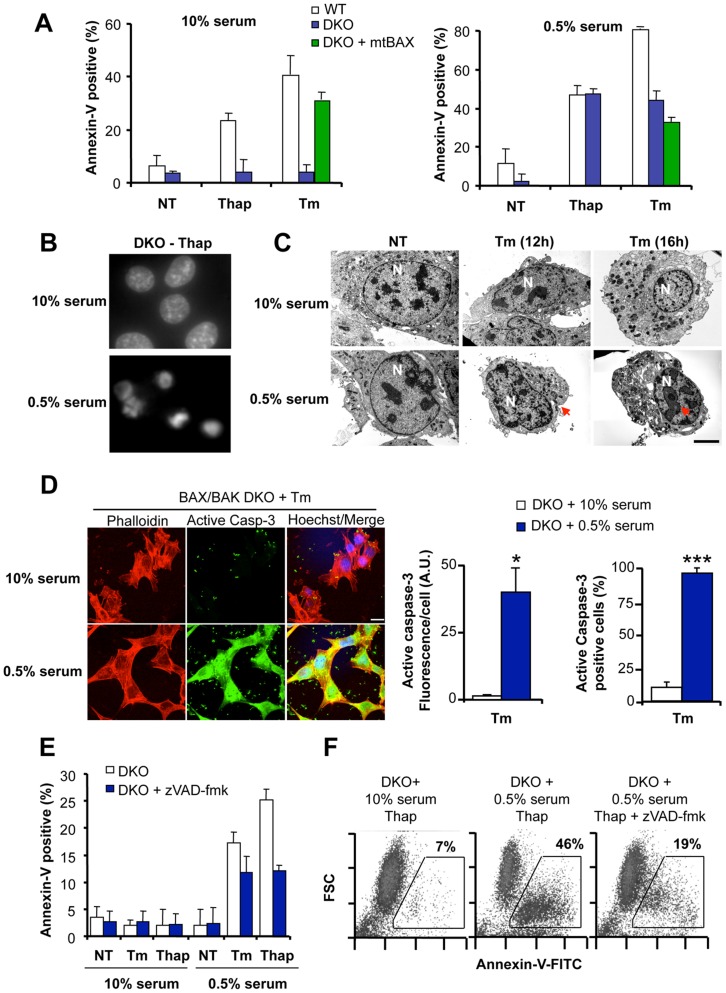
Figure 2. BAX and BAK double deficient cells undergo caspase-dependent apoptosis under conditions of ER stress in conjunction with serum withdrawal.
(A) Left panel: WT, BAX/BAK DKO cells or DKO cells stably reconstituted with mitochondrial-targeted BAX (mtBAX) were treated with 10 µM Thap or 10 µg/ml Tm under normal growing conditions (10% serum). After 12 h, apoptosis was monitored by Annexin-V-FITC and PI staining followed by FACS analysis. Mean and standard deviations are presented of three determinations. Right panel: Alternatively, experiments were performed in cells pre-treated for 2 h with cell culture media containing 0.5% serum, followed by the addition of ER stress agents. (B) BAX/BAK DKO cells were exposed to 10 µM Thap in the presence of cell culture media containing 10% serum or pretreated in media containing 0.5% serum, and then cells were stained with Hoechst to visualize nuclear morphology by fluorescent microscopy. (C) Cell morphology was monitored in BAX/BAK DKO cells treated with Tm for 12 h or 16 h under normal growing conditions or in cells pretreated for 2 h with media containing 0.5% serum. Untreated (NT) cells are also presented as control. Red arrowheads indicate classical apoptosis morphological features including chromatin condensation and fragmentations. In addition cell shrinkage is observed in the analysis. N: nucleus. (D) BAX/BAK DKO cells were exposed to 10 µg/ml Tm in the presence of cell culture media containing 10% serum (top panel) or pretreated in media containing 0.5% serum (Botton panel). After 10 h, active caspase 3 (green) was evaluated by indirect immunofluorescence. To visualize cells, actin was monitored with Phalloidin-Rhodamine staining, and nuclei were stained with Hoechst (blue). Images were acquired with a confocal microscope and represent the result of four independent experiments. Left panel: Quantification of the levels of active caspase-3 per cell by measuring fluorescent pixel intensity/area (A.U.) or the percentage of cells with positive active caspase-3 signal over a cutoff definer in non treated cells. Mean and standard deviation is presented of four experiments. Student’s T-test was used to analyze statistical significance between both groups (*: p<0.05; ***: p<0.001). (E) BAX/BAK DKO cells were pretreated for 30 min with 10 µM zVAD-fmk or left untreated in media containing 10% or 0.5% serum (pre-incubation of 2 h), and then exposed to 10 µg/ml Tm or 10 µM Thap. After 12 h, Annexin-V-FITC staining was evaluated by FACS analysis. Mean and standard deviation is presented of three determinations. (F) In parallel, the correlation between Annexin-V-FITC staining and cell shrinkage was evaluated by FACS by monitoring forward scatter parameter in cells described in (E). Data represent the results of three independent experiments.

