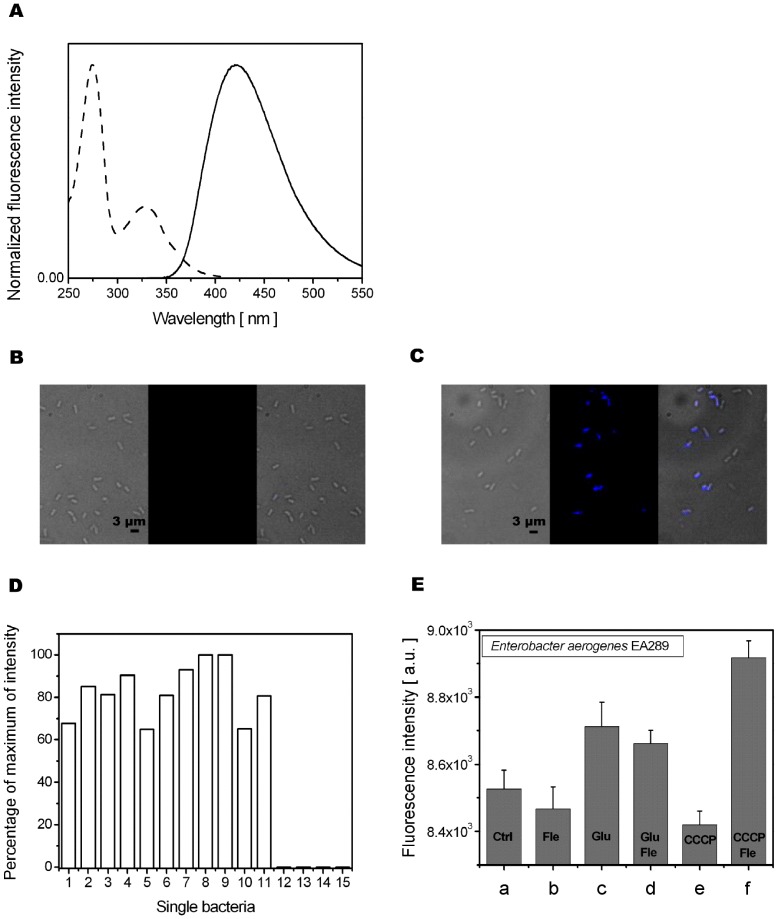
Figure 2. Fleroxacin uptake by individual Enterobacter aerogenes. A.
. Fluorescence spectra of Fle (750 ng/ml) in PBS pH = 7: (−−−) excitation spectrum at λemis = 420 nm; (–) emission spectrum at λexc = 313 nm. B. Transmission (left), fluorescence (middle) and merge (right) images of Fle (64 µg/ml)-treated EA289 bacteria. Scale bar corresponds to 3 µm. C. Transmission (left), fluorescence (middle) and merge (right) images of Fle (64 µg/ml)- and CCCP- (25 µM) treated EA289 bacteria. Scale bar corresponds to 3 µm. D. Percentage of maximum fluorescence intensity of Fle within single bacteria from fig. 2C. E. Fluorescence intensity detected from Fle channel (λexc = 290 nm; DM 300 nm; BP filter 420≤ λemis ≤480 nm) from individual EA289 bacteria as a function of treatment conditions: (a) EA289 with no additions; (b) EA289 incubated with Fle (64 µg/ml); (c) EA289 incubated with Glu; (d) EA289 co-incubated with Glu and Fle (64 µg/ml); (e) EA289 incubated with CCCP (25 µM); (f) EA289 co-incubated with CCCP (25 µM) and Fle (64 µg/ml).

