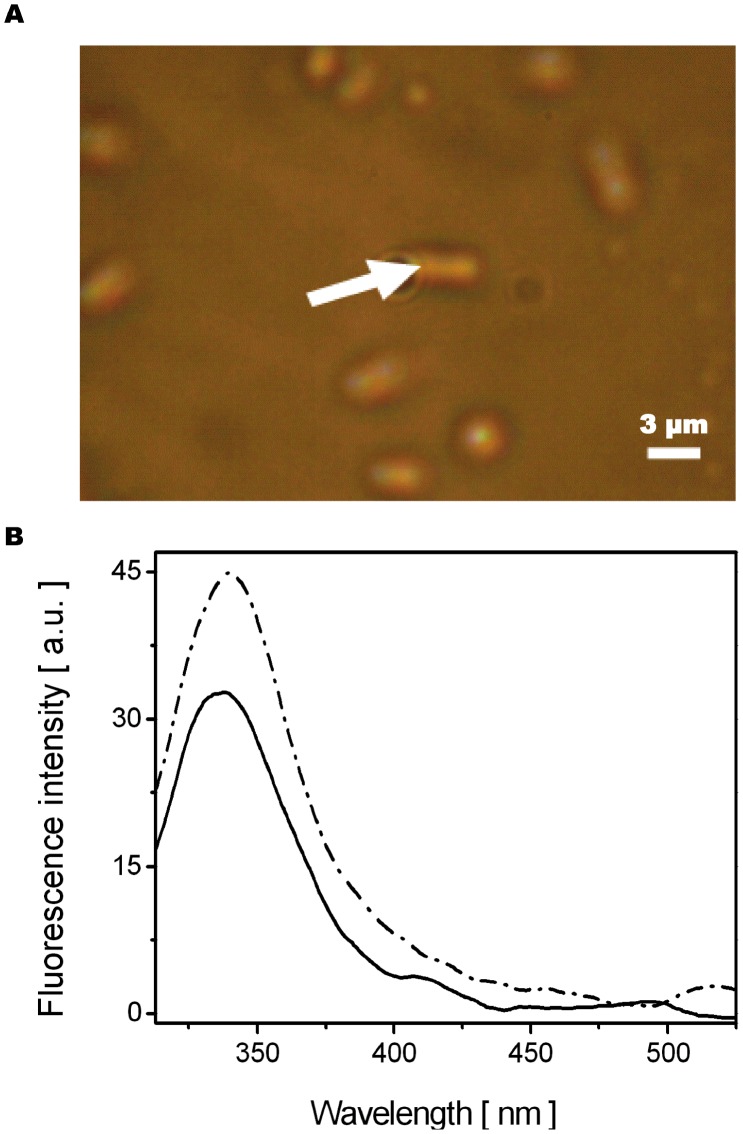
Figure 3. Individual bacteria microspectro-fluorescence measurement. A.
. Transmission image of Enterobacter aerogenes EA289 bacteria. White arrow indicates on bacterium from which one of the fluorescence spectra of fig. 3B was taken. Scale bar corresponds to 3 µm. B. Fluorescence emission spectra (recorded by UV-VIS microspectrofluorimetry at λexc = 290 nm) from two individual Fle-untreated bacteria EA289. Fluorescence emission spectrum (− ·− ·) corresponds to bacterium marked on fig. 3A; (–) spectrum corresponds to bacterium not in the field of view.

