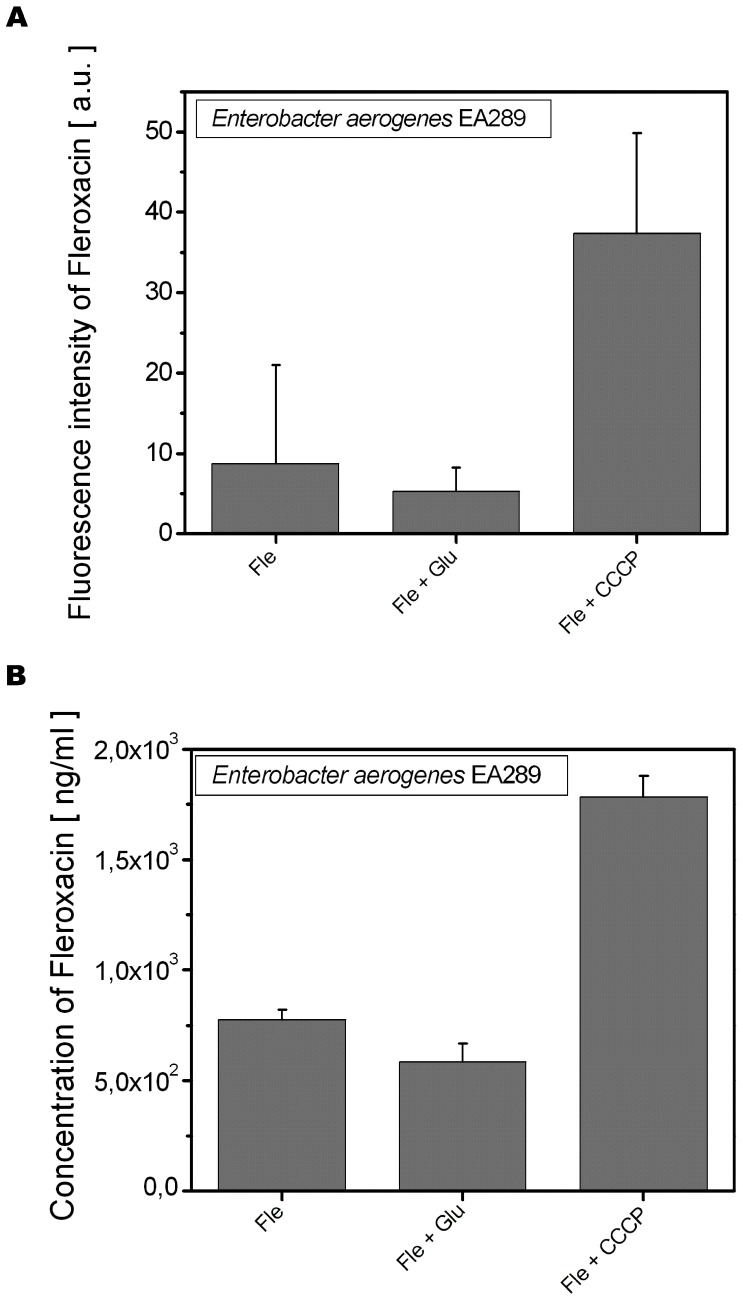
Figure 5. Comparison of fluorescence intensity and concentration of Fleroxacin in individual bacteria and lysated bacteria. A.
. Fluorescence intensity of Fle measured by UV-VIS microspectrofluorimetry from individual EA289 bacteria. EA289 were incubated with Fle (64 µg/ml) only or with Glu (0.4%) or CCCP (25 µM). B. Comparison of Fle concentration uptake determined from lysated bacteria. Enterobacter aerogenes EA289 were incubated with Fle (64 µg/ml) alone or with Glu (0.4%) or CCCP (25 µM).

