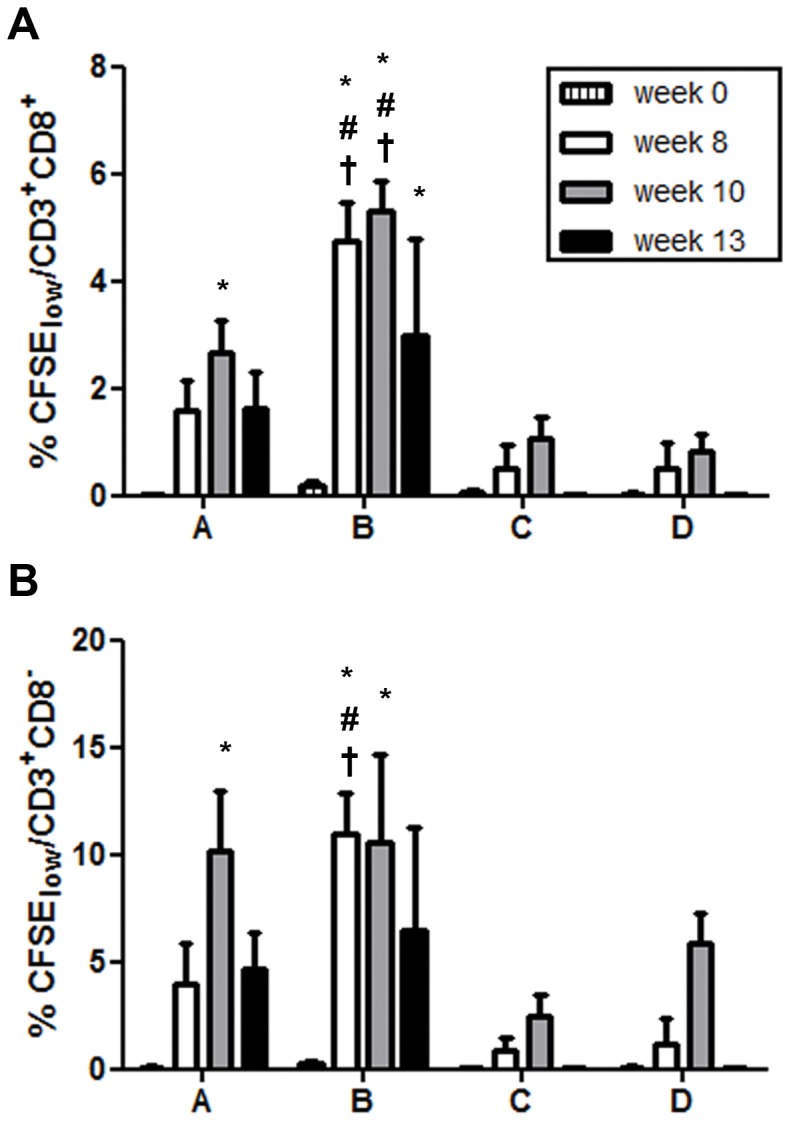
Figure 5. Development of proliferative CD4+ and CD8+ T-cell responses following DNA immunization.

Before and at the indicated time points following immunization, CFSE-labeled PBMCs were incubated with AT-2 SIV or microvesicles. On day 7, T-cell proliferation was assessed as the percentage of CFSElow CD4+ (gating on live CD3+CD8−, A) and CD8+ (gating on live CD3+CD8+, B) T cells. Data obtained with microvesicles were subtracted, and means and standard error of the means (SEM) are shown (#, p<0.05 compared with C and D, †, p<0.05 compared with A; one-way ANOVA followed by Bonferroni Post test; *, p<0.05 for differences to baseline; two-way ANOVA).
