
Figure 1. Parameters analyzed for automated image analysis and infection level measurement.
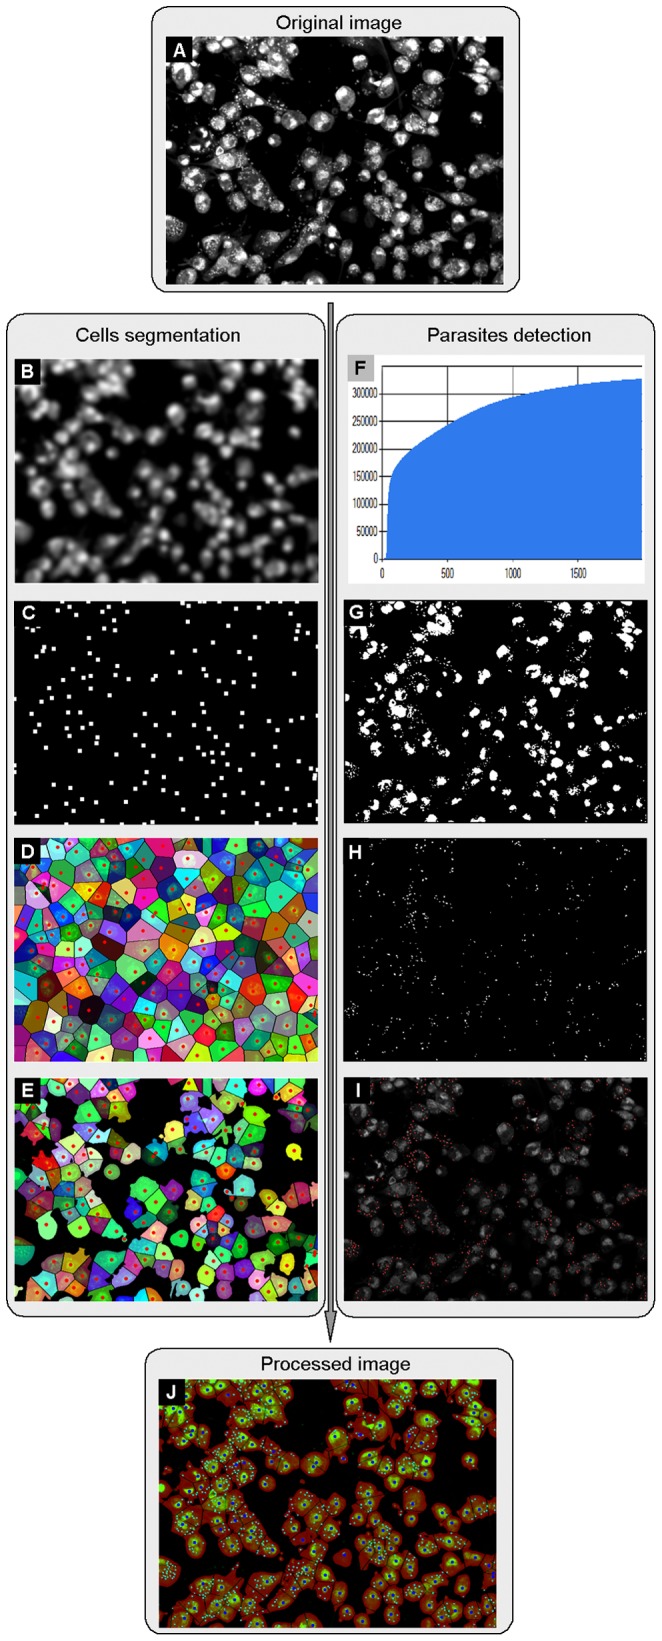
A) Input image: Raw image input acquired with Opera confocal microscope. B–E) Cell segmentation based on nuclei detection. B) Image denoising by a Gaussian kernel of radius 5. C) Local maxima point detection from B to define nuclei positions. D) Voronoi diagram computation based on the nuclei positions to delineate the inner boundaries of the attached cells. E) Threshold cut-off of pixels below a selected intensity level to make the foreground mask. This image is an example of final cell segmentation. F–I) Parasite detection. F) Calculation of the upper 50% cumulative intensity level of the raw image (A). G) Threshold cut-off of pixels below the intensity level of (F). H) Objects smaller than 4 or larger than 15 pixels are removed to classify parasites. I) Parasite positions are defined. J) Result image: the merged images of cell segmentation (E) and parasite detection (I).