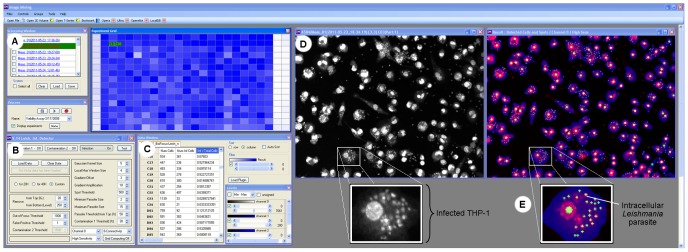
Figure 2. Software interface.
A) List of plates in the left and graphical representation of the infection ratio of a 384-well plate by gradient color intensity: white is 0% infection, and blue is 100% infection, with the colors in between indicating an intermediate infection ratio. The first two columns carry controls of amphotericin B EC100-treated wells and non-treated wells (1% DMSO), respectively. The last two columns (23 and 24) are non-infected wells and contain non-infected THP-1 cells. B) The window control to set up the software parameters for optimal tuning. C) Table of parameters generated by the software analysis, including, from left to right, “total number of cells,” “number of infected cells” and “infection ratio.” D) A raw image at left and colors highlighting element detection after software analysis: blue (THP-1 cells), red (nuclei of THP-1 detected cells) and green (parasites). E) Close-up of a selected infected THP-1 from (D), highlighting the intracellular Leishmania parasite.

