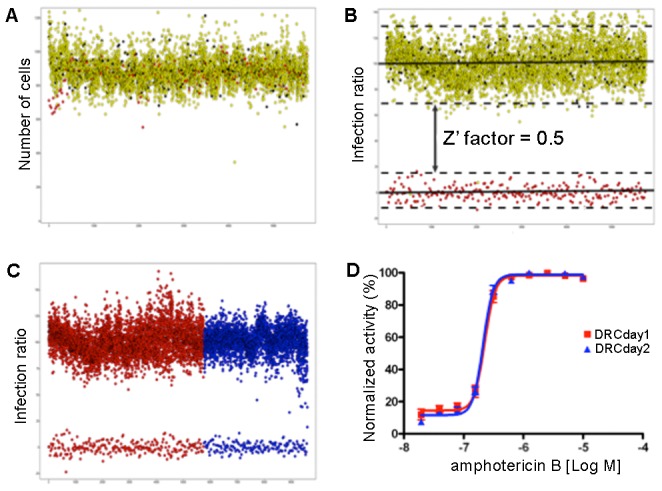
Figure 4. High-throughput screening validation.

A) Plot of the number of cells (Y-axis) in the controls: yellow (1% DMSO - compound position in the plate), black (1% DMSO – control position in the plate) and red (amphotericin B EC100). B) Plot of the infection ratio (Y-axis) using the same color code as in A). The Z' factor of 0.5 demonstrates the statistical confidence of the assay. C) Plot of the infection ratios (Y-axis) obtained from different validation days (red representing day 1 and blue representing day 2) demonstrating low day-to-day variation in the infection ratio and a clear window between non-treated controls (1% DMSO in the upper portion of the plot) and amphotericin B EC100-treated controls (lower portion of the plot). D) DRCs of amphotericin B from two independent validation days (red and blue curves representing days 1 and 2, respectively), demonstrating the consistency in the anti-leishmanial activity of the reference drug.
