
Figure 1. Summary of the genes differentially transcribed between resistant and susceptible strains.
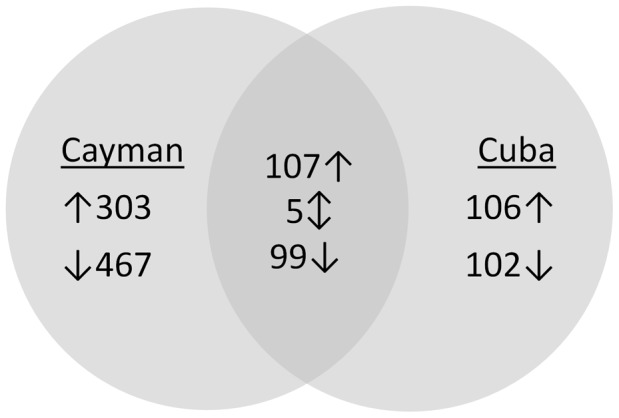
The Venn diagram shows the number of genes found significantly (P value<0.01) over- or under-transcribed (>2 fold in either direction) in one or both resistant strains compared to the susceptible New Orleans strain. Upward arrows indicate over- transcribed in resistant strains, downward represent under-transcribed.