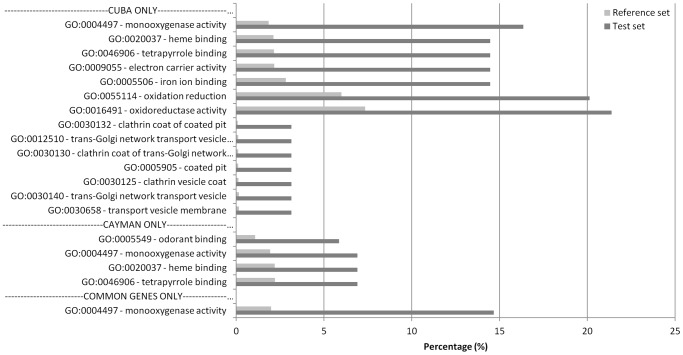
Figure 2. GO term enrichment analysis.
The analysis was performed on the significantly up-regulated genes found in CAYMAN and CUBA-DELTA compared to NO. The BLAST2GO software was used for the annotation, mapping and enrichment analysis. The figure represents all the significant GO-term categories found significantly enriched compared to the reference set (all transcripts present on the microarray) after a Fisher's exact test and Benjamini and Hochberg multiple testing correction (Pval<0.05). The test set percentage indicates the percentage of up regulated genes belonging to a GO term category compared to all up-regulated genes used in the GO-term analysis while the reference set percentage indicates the percentage of a particular GO-term category compared to all genes with GO-terms on the microarray.

