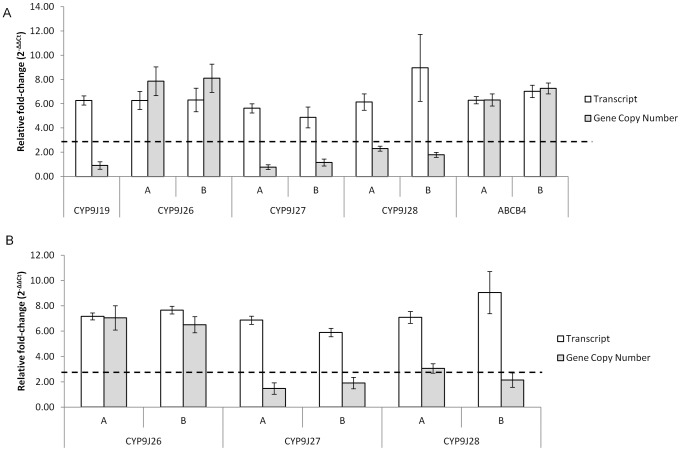
Figure 3. Quantitative PCR analysis of selected genes from the microarray experiments.
Relative-fold change in transcript and gene copy number normalised to two ribosomal genes was compared between the resistant CAYMAN (A) and CUBA-DELTA (B) strains against the NEW ORLEANS susceptible strain. Transcript levels are shown by the white columns and gene copy numbers by the grey columns. Error bars represent 95% confidence intervals.

