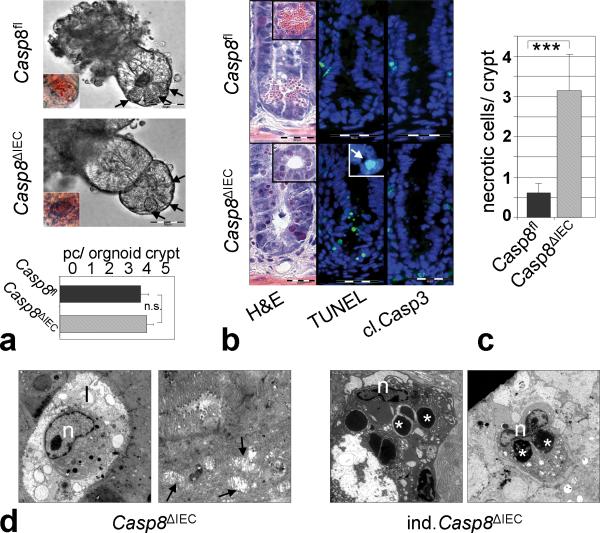
Figure 2. Increased caspase-8 independent cell death within crypts of Casp8ΔIEC mice.
(a) Representative pictures of gut organoids. Inset = Eosin staining indicating Paneth cells. Graph: Number of Paneth cells (pc) per organoid crypt (n=24) +SEM. (b) Crypt cross sections from the small intestine of control and Casp8ΔIEC mice stained with H&E. TUNEL ( Inset: condensed nuclei) and caspase-3. (c) Quantification of necrotic cells per crypt + SD of control (n=9) and Casp8ΔIEC (n=14) mice. (d) Electron microscopic pictures of dying crypt cells in Casp8ΔIEC mice and inducible Casp8ΔIEC. Asterisks, Paneth cell granules; “n”, nuclei; “l”, crypt lumen; Arrows: mitochondrial swelling.

