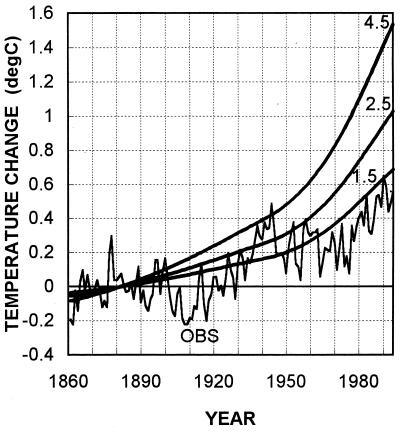
Figure 5.
Observed (OBS; IPCC) and modeled temperature changes for GHG forcing alone. Modeled changes are given for climate sensitivity (ΔT2×) values of 1.5°C, 2.5°C, and 4.5°C. All series have been adjusted to have zero mean over 1861–1900. 1994 is the last year shown. The same results have been presented in the 1995 IPCC report (31).

