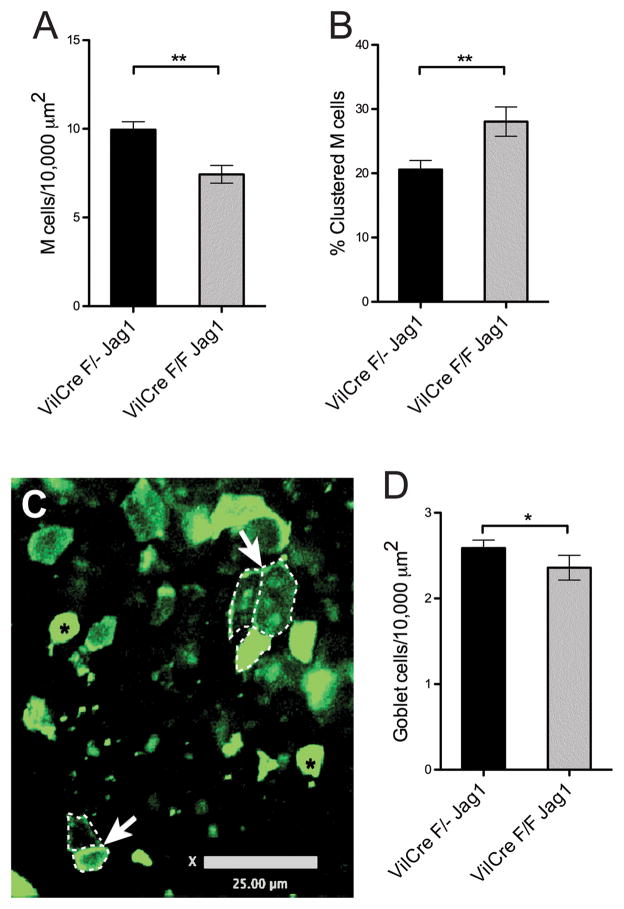
Figure 3. FloxJagged1 Peyer’s patches have fewer M cells but increased clustering.
A. Direct quantitation of M cell density across Peyer’s patch epithelium showed that, in contrast to Notch1 conditional knockout mice, there were reduced numbers in Jagged1 conditional knockout mice compared to wild type. (single flox Jag1 N=32; FloxJag1 N=32;**, P<0.005)
B. Quantitation of M cell clustering (measured as described for Notch1 conditional knockout). Despite the decrease in M cell density, Jagged1 conditional knockout Peyer’s patch epithelium showed increased M cell clustering. (single flox Jag1 N=32; FloxJag1 N=32; **, P<0.005)
C. Confocal image of FloxJagged1 Peyer’s patch whole mount showing M cell clustering (outlined by dotted lines, arrows). Two goblet cells are identified with black asterisks. (Scale bar: 25 μm)
D. Goblet cell density counts showed a slight reduction in Jagged1 conditional knockout Peyer’s patch compare to wild type, though not as strong as the reduction in M cell density. (single flox Jag1 N=32; FloxJag1 N=32; *, P<0.05)

