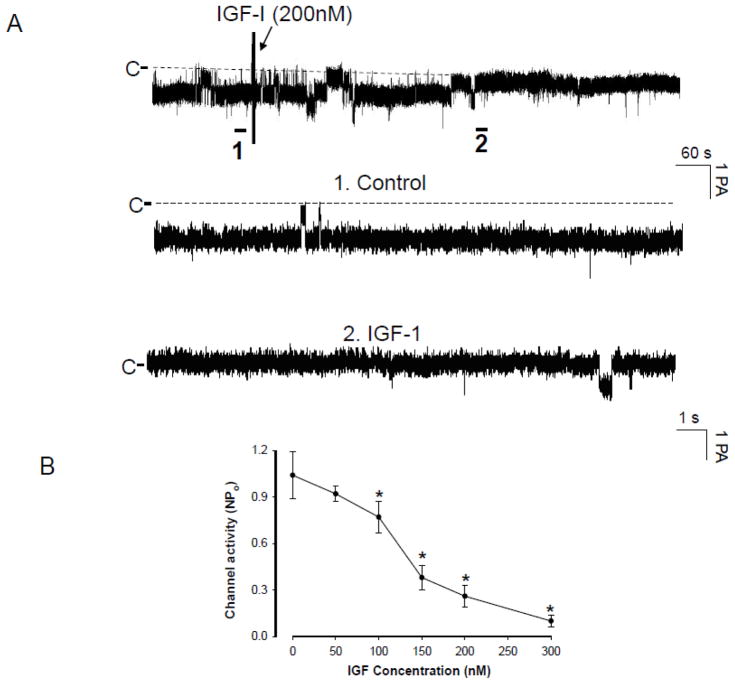
Fig. 1.
(A) A channel recording demonstrating the effect of IGF-1 on the 10-pS Cl channels in the medullary TAL. The experiments were performed in cell-attached patches and the holding potential was -60 mV. The arrow indicates the addition of IGF-1. Two parts of the traces indicated by numbers are extended to show the fast time resolution. The channel closed level is indicated by “C” and a dotted line. (B) A dose–response curve of IGF-1’s effect on the Cl channels in cell-attached patches. Asterisk indicates that the difference is significant in comparison to the control value.

