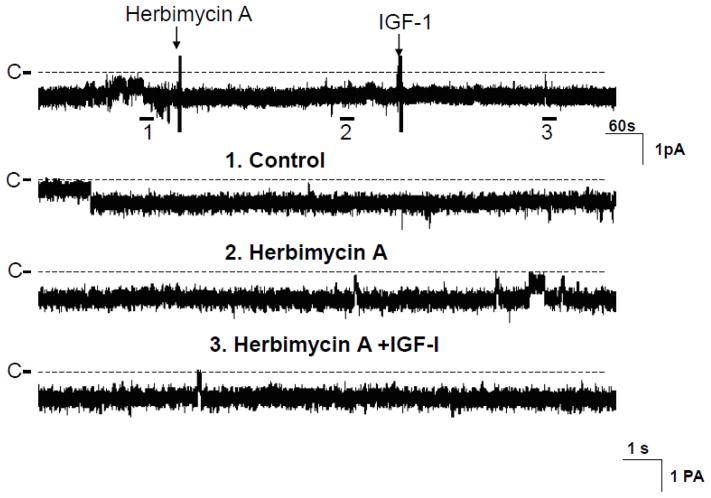
Fig. 3.
A channel recording showing the effect of IGF-1 (200 nM) on the Cl channels in the presence of herbimycin A (1 μM). The top trace shows the time course of the experiments and three parts of the recording indicated by numbers are extended to demonstrate the fast time course. The channel closed level is indicated by “C” and a dotted line. The experiments were performed in cell-attached patch and the holding potential was −60 mV.

