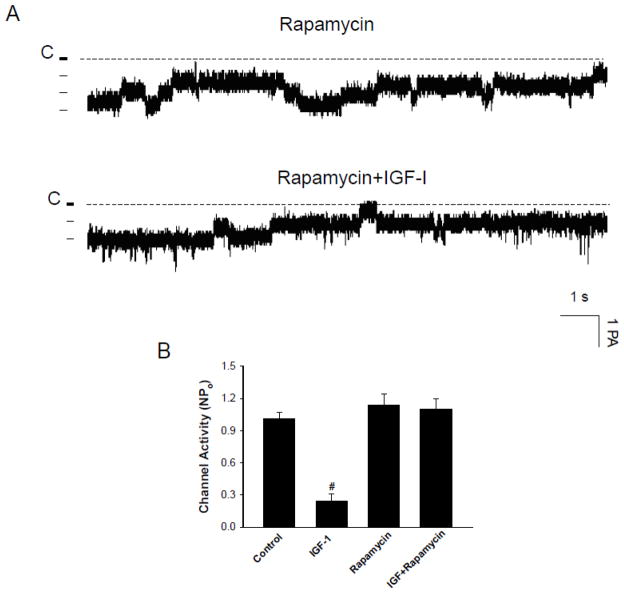
Fig. 9.
(A) A channel recording demonstrates the effect of 200 nM IGF-1 on the 10-pS Cl channels in the presence of rapamycin (100 nM). The experiments were performed in cell-attached patches and the holding potential was −60 mV. (B) A bar graph summarizing experiments in which the effect of IGF-1 on the Cl channels was examined in the presence of rapamycin (control NPo, 1.01±0.1; IGF-1, 0.24±0.06;; rapamycin, 1.14±0.1; IGF+rapamycin, 1.1±0.1) (n=4–5). “#” indicates a significant difference in comparison to the control.

