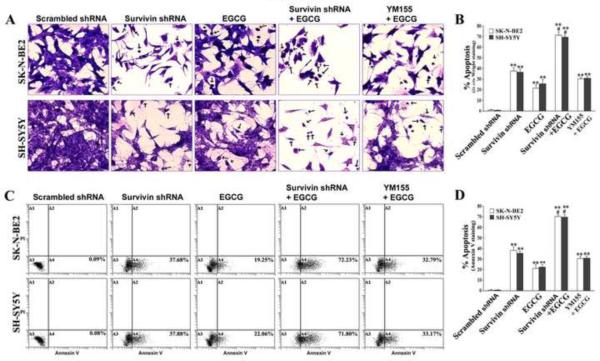
Fig. 4.
Determination of morphological and biochemical features of apoptosis. Treatments: transfection with plasmid vector carrying scrambled shRNA cDNA (0.5 μg/ml) for 48 h, transfection with plasmid vector carrying survivin shRNA cDNA (0.5 μg/ml) for 48 h, 50 μM EGCG for 24 h, survivin shRNA (0.5 μg/ml) for 48 h + 50 μM EGCG for last 24 h, and 50 nM YM155 for 48 h + 50 μM EGCG for last 24 h. (A) In situ Wright staining for morphological features of apoptosis. (B) Bar diagrams showing percentage of apoptosis based on in situ Wright staining. Mean values of 3 independent experiments are shown. **p < 0.01; #p < 0.05 (**compared with scrambled shRNA; # compared combination therapy with survivin shRNA or EGCG alone). (C) Staining with Annexin V-FITC and flow cytometry for determination of percentage of apoptotic cells. Apoptotic cells (Annexin V-FITC positive and PI negative) are represented by dot plot in A4 quadrant (bottom right) on x-axis. (D) Bar diagrams to show percentage of apoptosis based on accumulation of Annexin V positive cells in A4 quadrant. Mean values of 3 independent experiments are shown. **, p < 0.01; #p, <0.05 (**compared with scrambled shRNA; # compared combination therapy with survivin shRNA or EGCG alone).

