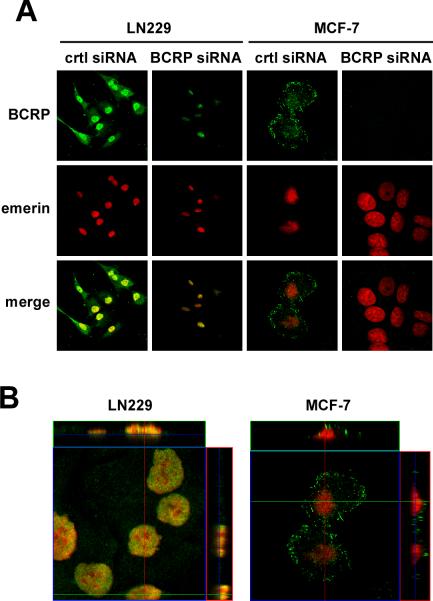
Figure 2. Cellular distribution of BCRP by confocal laser microscopy.
LN229 cells and MCF-7 cells were transfected with control and BCRP siRNAs for 24 h. Cells were then fixed and immunolabeled with monoclonal anti-BCRP (green, upper panels) and polyclonal anti-emerin (red, middle panels) antibodies. Merge images are shown in the bottom panels. Areas of nuclear co-localization between BCRP and emerin appear in yellow in LN229 cells, which were absent in MCF-7 cells. Similar results were obtained in 3 independent experiments. (B) Vertical sections in the XY and XZ planes of confocal images from LN229 and MCF-7 cells tranfected with control siRNA. Magnification 40X.

