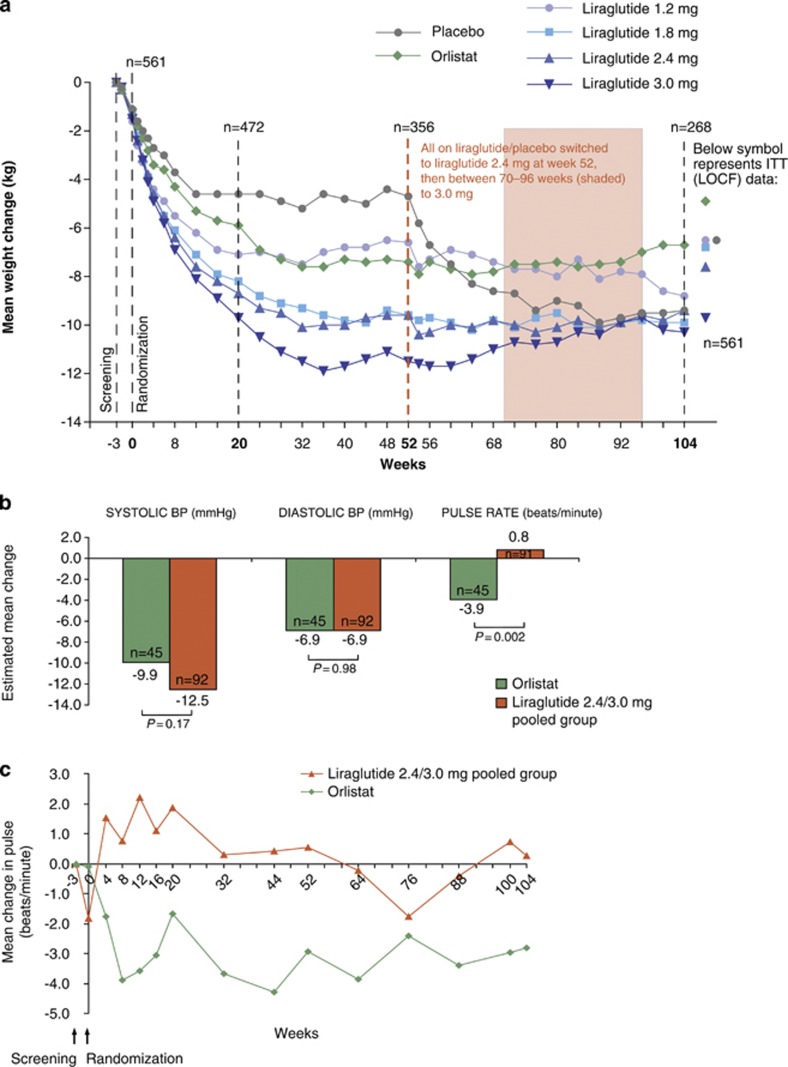
Figure 3.
(a) Change in body weight from screening over 2 years, presented as observed data for individuals completing each scheduled visit. (b) Estimated (ANCOVA) changes in BP and pulse rate from screening to year 2 for the completer population. (c) Mean change in pulse rate over 2 years, presented as observed data for the intention-to-treat population (with no imputation).

