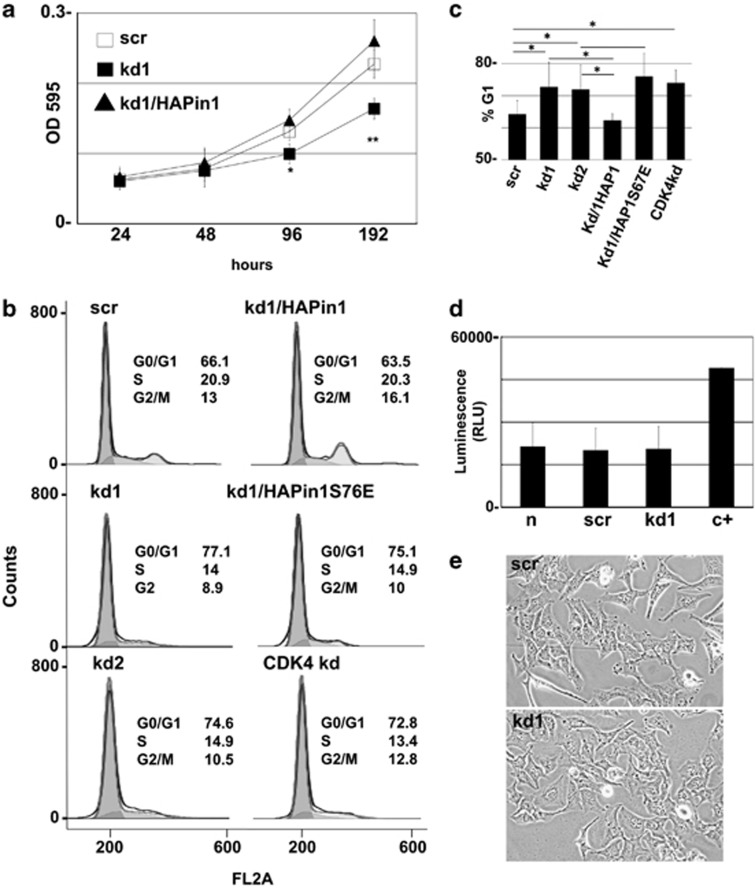
Figure 2.
CDK/cyclin complexes are unchanged and pRb is hypophosphorylated in T98G PIN1 KD cells. (a) Proliferation assay showing that PIN1 KD cells have reduced proliferation rate. Data shown represent mean±S.D., n=4. OD, optical density; *P<0.05, **P<0.01. (b) A representative FACS analysis that shows PIN1 KD cells (kd1 and kd2) have an increased number of cells in G1 compared with scrambled (scr) cells. Overexpression of Pin1, but not the catalytically inactive form, restores the phenotype of PIN1 KD cells. (c) Average of six experiments as in (b). The percentage of G1 cells is shown (*P<0.05). (d) Caspase assay. Three independent experiments were analyzed: normal (n), scrambled (scr), and PIN1 knockdown (kd1) cells; positive control cells treated with 1 μM doxorubicin for 18 h (c+). RLU, relative light unit per second. (e) Light microscope images at × 10 magnification showing no morphological difference between scrambled and PIN1 KD cells

