Figure 1.
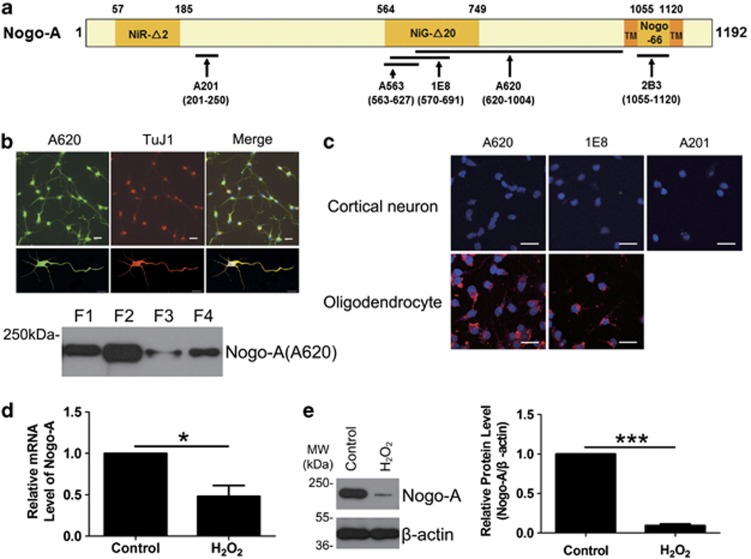
Nogo-A expression in cortical neurons. (a) The diagram for antibodies against different antigen recognition sites of human Nogo-A NiR-Δ2 (amino acids (aa) 57–185), NiG-Δ20 (aa 564–749) and Nogo-66 (aa 1055–1120) are the three inhibitory regions of human Nogo-A. TMs are transmembrane domains located on the two sides of Nogo-66. The arrows indicate the target regions of five Nogo-A-specific antibodies, polyclonal antibody (pAb) A201 against aa 201–250, monoclonal antibody (mAb) A563 against aa 563–627, mAb 1E8 against aa 570–691 and pAb A620 against aa 620–1004. 2B3 is targeted to Nogo-66, aa 1055–1120. (b) Top: the expression of neuronal Nogo-A was immunostained with A620 and TuJ1, an immature neuronal marker. Lower: subcellular distribution of neuronal Nogo-A was blotted with A620. Cytosolic (F1), organelle/membrane (F2), nucleic (F3) and cytoskeleton fractions (F4) were the four subcellular fractions of neurons. (c) Living cell staining for neurons were performed with pAb A620, mAb 1E8 or pAb A201 (top). The A620 and 1E8 antibodies had previously been shown to label the extracellular amino-Nogo-A in oligodendrocytes (lower). (d) The total RNA was extracted from neurons exposed to 50 μM hydrogen peroxide (H2O2) for 8 h or not and submitted to quantitative real-time polymerase chain reaction (PCR). β-Actin was selected as an inner standard. (e) Cell lysates from neurons exposed to 50 μM H2O2 for 8 h or not were blotted with pAb A620. β-Actin was selected as an inner standard (left). Quantification by densitometric scans was presented by Nogo-A/β-actin (right). Bar=50 μm. n=3, mean±S.D., paired t-test, *P<0.05, ***P<0.001

