Figure 1.
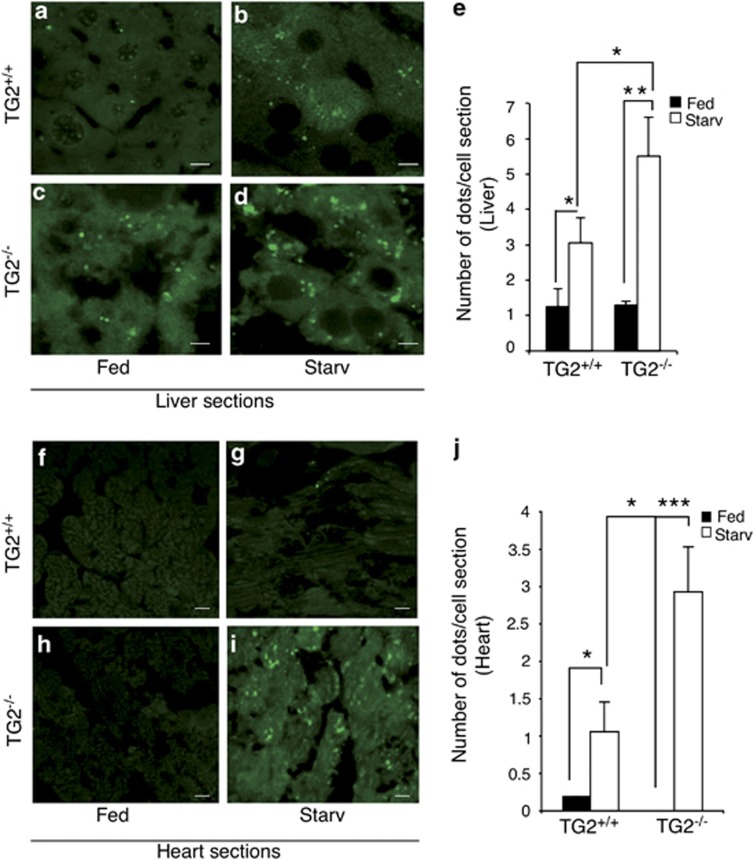
Effect of starvation on liver and heart autophagy in TG2+/+ GFP-LC3 or TG2−/− GFP-LC3 mice. (a and b) Liver samples from TG2+/+ GFP-LC3 transgenic mice before (a) and after 48 h of starvation (b) were analyzed by fluorescence microscopy. (c and d) Liver samples from TG2−/− GFP-LC3 transgenic mice before (c) and after 48 h of starvation (d) were analyzed by fluorescence microscopy. Scale bar, 8 μm. (e) Quantitative analysis of the formation of GFP-LC3 dots following autophagy-induction. The number of dots was counted in five independent fields of three independent mice. Results are expressed as the mean±S.D. Statistical analysis was performed by analysis of variance (*P<0.05). (f and g) Heart samples from TG2+/+ GFP-LC3 transgenic mice before (f) and after 48 h of starvation (g) were analyzed by fluorescence microscopy. (h and i) Heart samples from TG2−/− GFP-LC3 transgenic mice before (h) and after 48 h of starvation (i) were analyzed by fluorescence microscopy. Scale bar, 3 μm. (j) Quantitative analysis of the formation of GFP-LC3 dots following autophagy-induction. The number of dots was counted in five independent fields of three independent mice. Results are expressed as the mean±S.D. Statistical analysis was performed by analysis of variance (*P<0.05, **P<0.001, ***P<0.0001)

