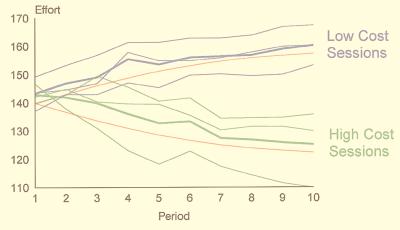
Figure 2.
Experiment based on the coordination game, using randomly matched student subjects who made effort decisions independently in a sequence of 10 periods. Average effort choices are given by the thin green lines for the low-cost sessions (with c = 0.25) and by the thin blue lines for the high-cost sessions (with c = 0.75). The thick lines show average efforts for both treatments. As simple economic intuition would suggest, higher effort costs result in lower efforts, an effect that is not predicted by the Nash equilibrium. Note that, in one of the high-cost sessions, effort choices gravitate toward the lowest possible effort choice of 110, the equilibrium that is worst for all concerned. The thin red lines give the average effort choices predicted by an evolutionary adjustment model in which players tend to move in the direction of higher payoffs but may make mistakes in doing so.

