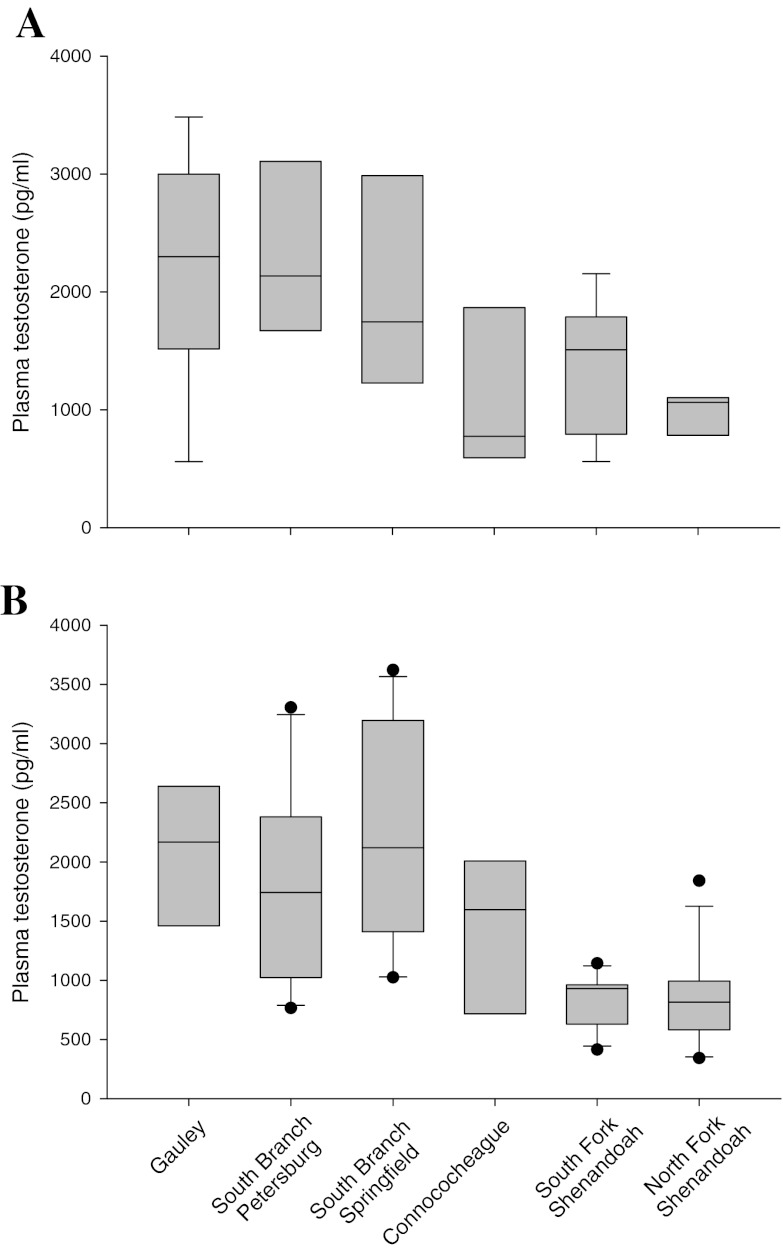
Fig. 5.
Plasma concentrations of testosterone in smallmouth bass collected in the Gauley and Potomac drainage in 2007. a Female, b male. The box represents the 25–75 percentile, the whiskers the 10th and 90th percentiles, the horizontal line within the box is the median, and outliers are indicated by dots

