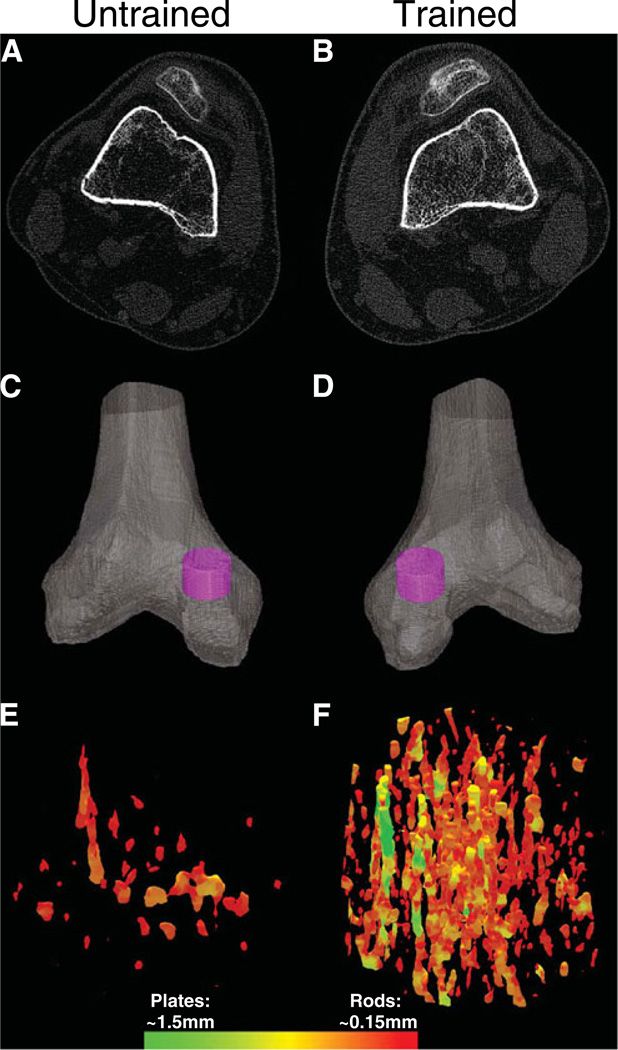
Fig. 5.
Representative example of CT images from a subject in the High Dose cohort. Images in the left-hand column are from the subject’s untrained limb. Images from the right-hand column are from the subject’s trained limb. a, b Cross-sectional CT images at the 12% femur sites. c, d Cylindrical regions of interest within each medial femoral condyle. e, f Three-dimensional reconstruction of the trabecular lattice within each region of interest. The color scale corresponds to voxels assigned as plates and rods during volumetric topologic analysis (VTA). The maximum and minimum dimensions of plates and rods are listed

