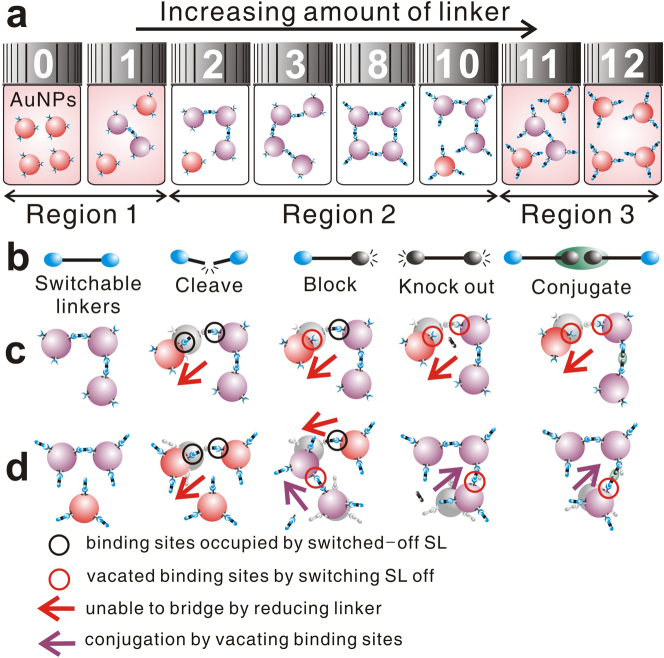
Figure 1.
(a) Linker concentration can be grouped into three regions for a given amount of NPs based on the observable visual color change. Numbers on the bottle lids represent the number of linkers. (b) Different possible SL designs (top row) and the corresponding effects of switching off SLs to reduce the nLK by 1 at low (middle row) and high (bottom row) concentration of SL.

