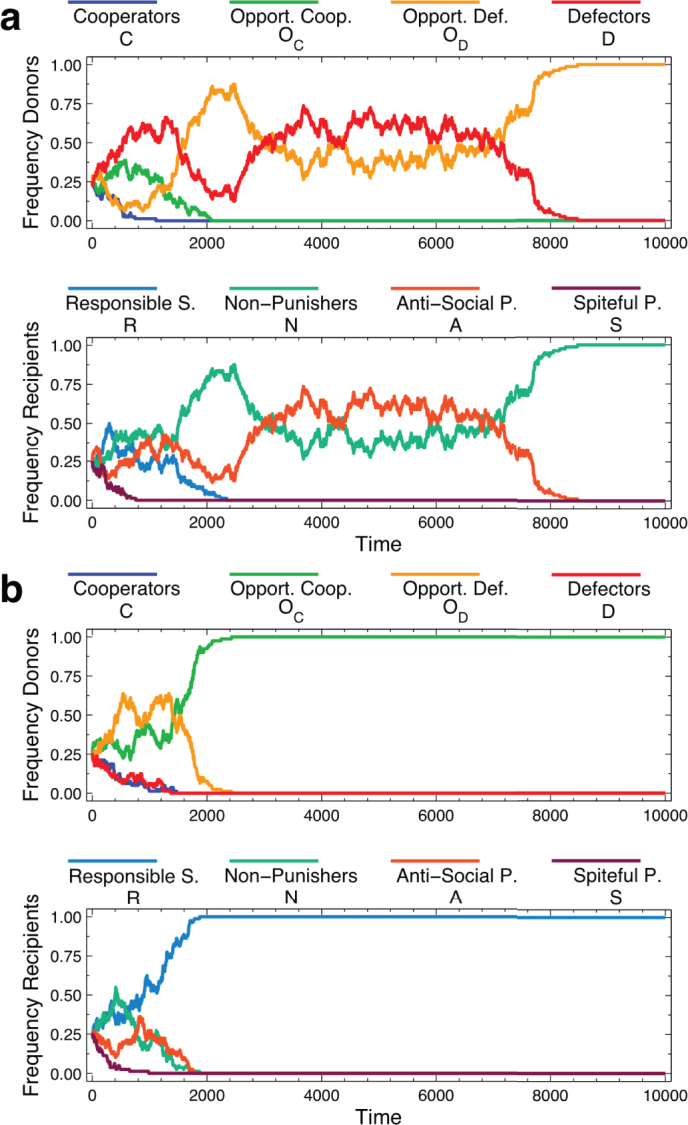
Figure 2. Time evolution of responsible punishment.

Two typical individual-based simulation runs, without (a) and with (b) reputation. In both cases, the upper graph depicts the dynamics among the donors' strategies, whereas the lower graph shows the evolution of strategies among recipients. While a low information regime results in neutral drift between different non-cooperative strategies, individuals almost immediately switch to social sanctions and cooperation if their reputation is at stake. Parameter values are μ = 0.0001 and λ = 0 for (a) and λ = 0.3 for (b), respectively, the other parameter values being the same as in Figure 1.
