
Figure 3.
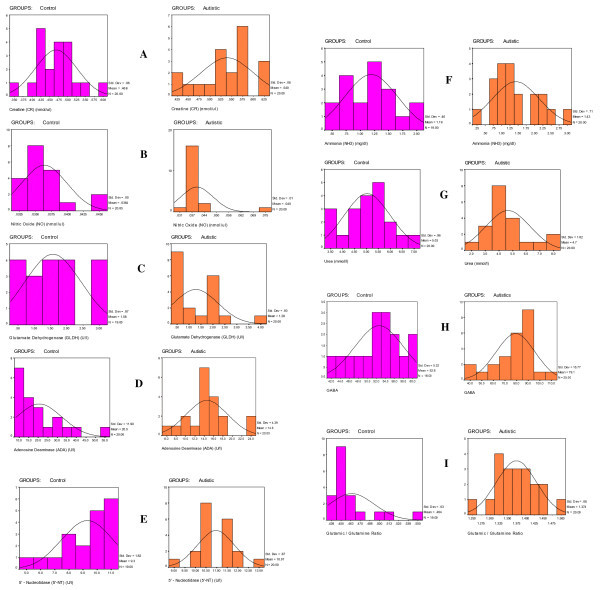
Normal distribution for the various measured parameters in the control and autistic groups. The scale of the X axis is different for the two groups, because of the marked differences between them.
Official websites use .gov
A
.gov website belongs to an official
government organization in the United States.
Secure .gov websites use HTTPS
A lock (
) or https:// means you've safely
connected to the .gov website. Share sensitive
information only on official, secure websites.
Normal distribution for the various measured parameters in the control and autistic groups. The scale of the X axis is different for the two groups, because of the marked differences between them.