Figure 4.

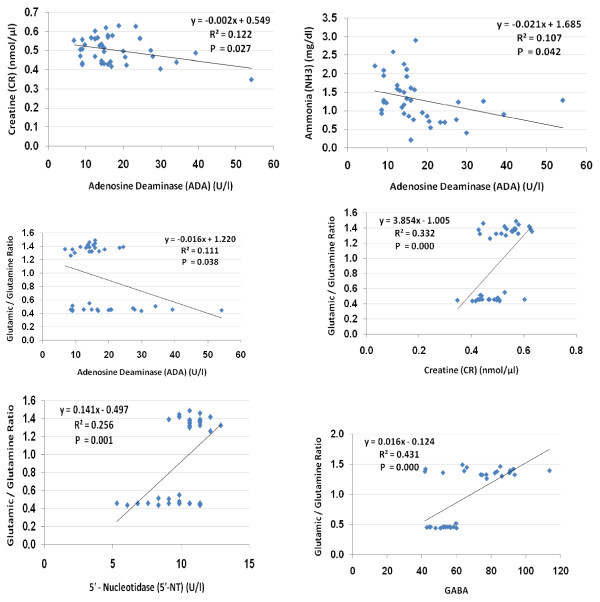
Pearson correlations between the measured parameters showing the best-fit line curve with either positive or negative correlations.

Pearson correlations between the measured parameters showing the best-fit line curve with either positive or negative correlations.