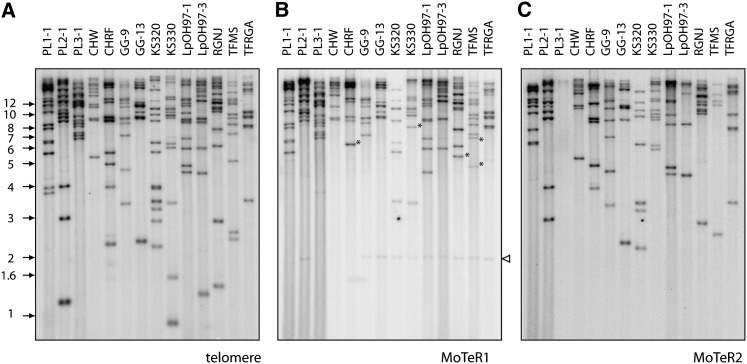
Figure 5 .
Genomic distribution of MoTER elements. PstI-digested DNA samples (∼200 ng/lane) were fractionated by electrophoresis and electroblotted to membranes. The immobilized DNAs were then hybridized with a MoTER1 probe (A). After exposure to a phosphorimage screen, the probe was stripped off and the DNAs were reprobed with a MoTER2-specific fragment (B). Finally, the DNA samples were hybridized with the telomere probe (C). Asterisks highlight MoTeR-containing fragments that did not hybridize to the telomere probe. Isolate names are listed above the relevant lanes, and molecular sizes are shown on the left. The white arrowhead marks a highly degenerate internal MoTeR sequence.

