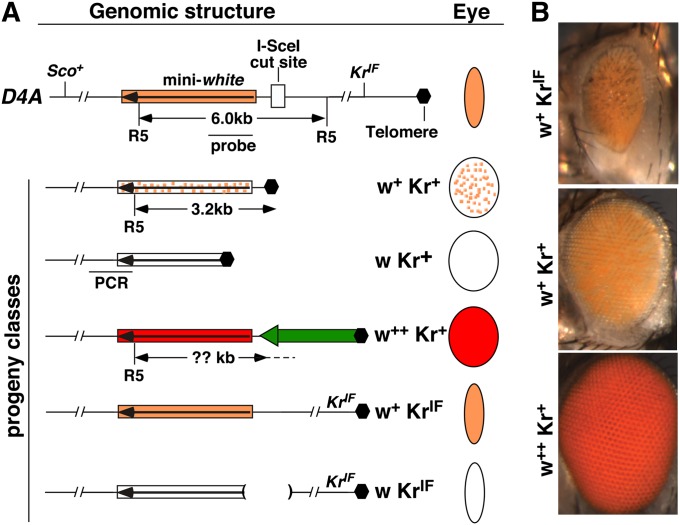
Figure 1 .
The terminal deficiency (TD) assay. (A) Genomic structure of the starting D4A chromosome is shown at the top, which has the wild-type Sco + gene and the dominant KrIF mutation. The structures of the D4A region in different progeny are shown below. The box with a long arrow depicts the mini-white marker gene, which is color coded in accordance with the different eye colors and patterns that it produces in different progeny. Schematic representation of the different eye colors and shapes are given in the “Eye” column. Different progeny classes are also defined by their phenotypes, which are given to the left of the eye diagrams. In the w + Kr + class, placement of white at the telomere resulted in a mottled pattern of eye pigmentation. In the w Kr + class, the white gene is 5′ truncated losing its expression. In the w + + Kr + class, a transposon (green block arrow) attached 5′ to white leading to its higher expression. In the w KrIF class, the deletion (parentheses) was generated during NHEJ repair, abolishing white expression. The positions of the cut site for EcoRV (R5) are given along with the location of the probe and the predicted size of the fragment, except in the case of w + + Kr + as the R5 location on the transposon is not known (question mark). The position of the PCR fragment used to test the presence of D4A sequence is shown for the w Kr + class of progeny. (B) Eye pictures of some of the progeny recovered with phenotypes given to the left.

