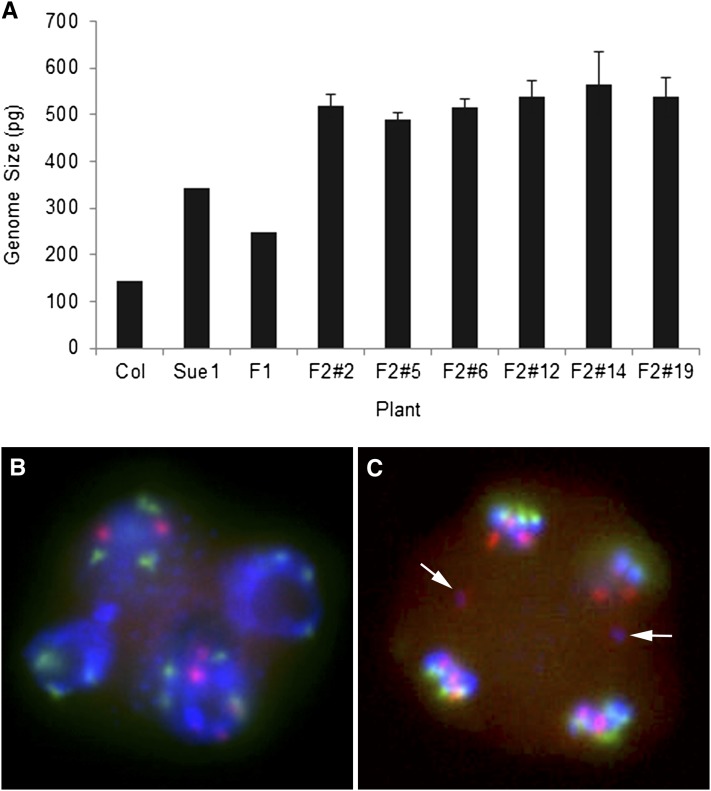
Figure 2 .
Genome size of parental species, triploid F1, and allohexaploid F2 individuals. (A) Genome sizes of 37 F2 plants (6 of them are shown) were measured using flow cytometry. Error bars represent SE, N = 1–2. (B) FISH of F1 pollen tetrad with irregular chromosome numbers. (C) Chromosome laggards (arrows) between developing tetrads of F1 triploid. Chromosomes were labeled with At- (green) or Aa (red)-specific centromeric probes and counterstained with DAPI.

