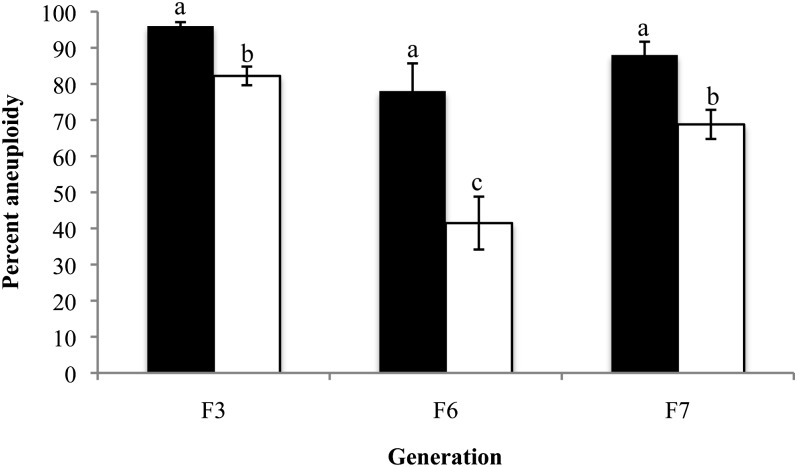
Figure 4 .
Somatic aneuploidy in individual cells of allohexaploids. The degree of aneuploidy was determined using FISH analysis (as in Figure 3) of plants from six sister lines over three generations. Aneuploidy was calculated on the basis of either divergence from the additive chromosome number (original euploid) of the two progenitors (solid bars) or adjusted modal (adjusted euploid) chromosome numbers (open bars) of each allohexaploid (see text for details). Error bars reflect the SEM. N = 204 cells (F3), N = 171 cells (F6), N = 626 cells (F7). Means between generations were compared within each type of analysis (solid or open bars) using ANOVA tests followed by Tukey post hoc analysis. Bars not connected by the same letter are statistically significantly different at P < 0.001 (adjusted euploid). (Original euploid comparisons (solid bars) P = 0.073, F = 2.72, d.f. = 2; adjusted euploid comparisons (open bars): P < 0.001, F = 14.74, d.f. = 2.

