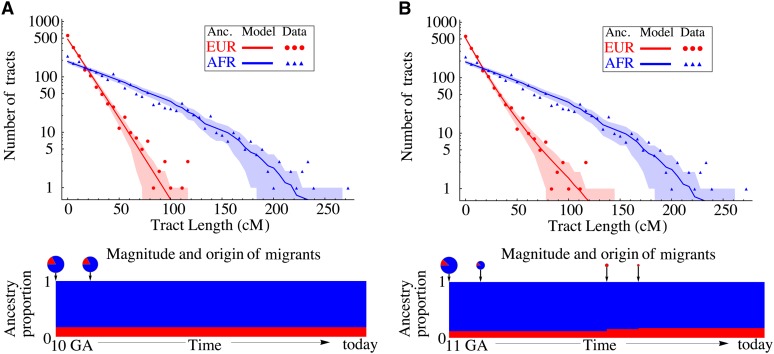
Figure 5 .
Distribution of continuous ancestry tract lengths in 20 HapMap African-American (ASW) trio individuals [as inferred by PCAdmix (Brisbin 2010), a local ancestry inference software], compared with predictions from a single-pulse migration model (top) and a model with subsequent European migration (bottom). Each dot represents the number of continuous ancestry tracts whose length is contained in one of 50 bins. The shaded area marks the 68.3% confidence interval based on the model. The second model, in which over 30% of European origin in the ASW samples is quite recent, provides a sufficiently better fit to justify the extra parameters (likelihood-ratio test, P = 0.002).

