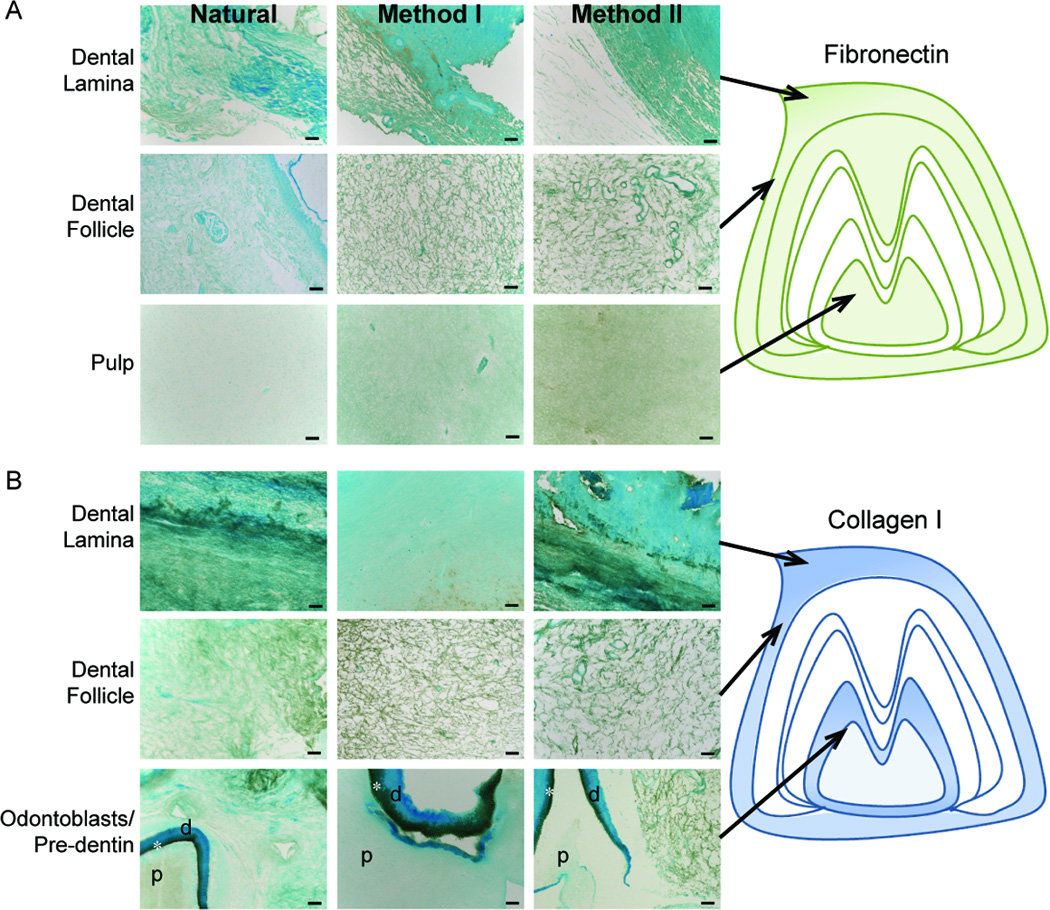
Figure 3. IHC analyses of fibrillar ECM protein expression.

(A) Fibronectin and (B) Collagen I expression in Natural, Method I, or Method II treated teeth. Schematic representations are shown to the right. Strong collagen I expression was observed in the pre-dentin region (*) between the pulp (p) and dentin (d). Scale = 50 microns.
