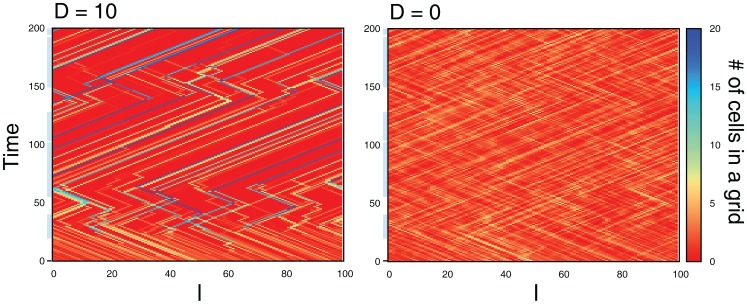
Figure 13.
Time evolution of the number of cells in grids from the randomly distributed initial condition in cases of D = 10 (left) and D = 0 (right). The periods that the preferred direction is hopping right is designated with light blue bar along the time axis. During the period without blue bar, the preferred direction is hopping left. Parameters are λ1 = 0.11, λ0 = 0.1, NC = 200, and Lx = 100.

