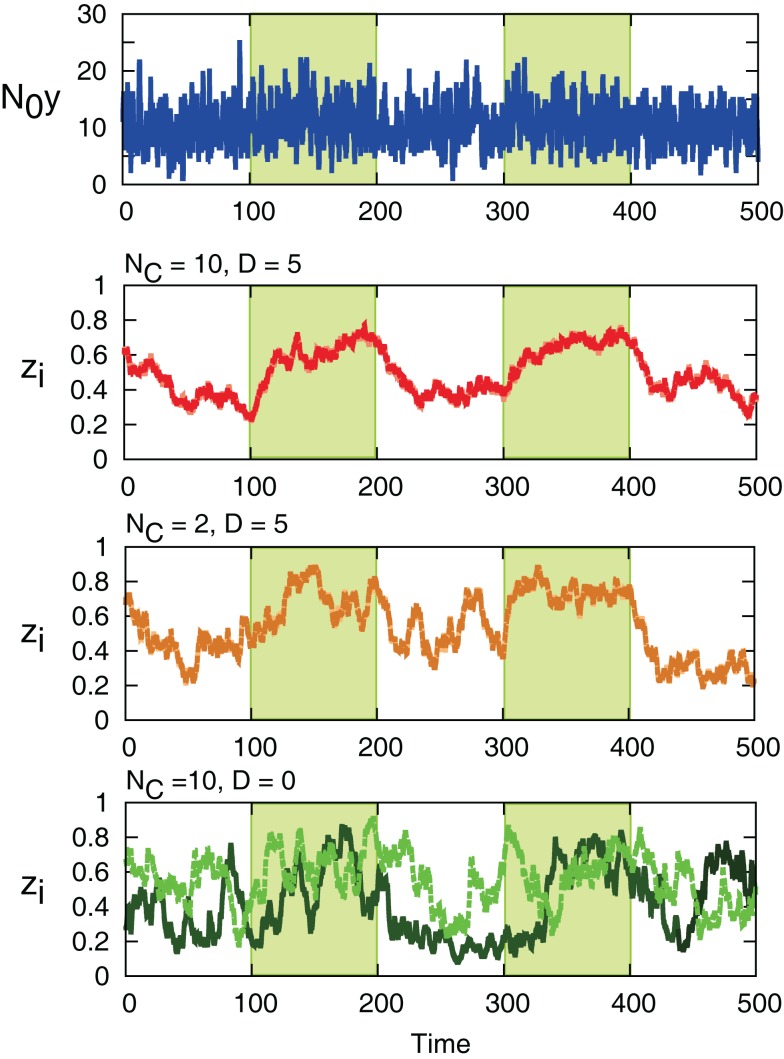
Figure 5.
Sample trajectories of N0y(t) (top) and zi for (NC, D) = (10, 5), (2, 5), and (10, 0). (NC, D) = (10, 0) corresponds to no interaction. For zi, the values of two cells in the system are shown with different colors. The green-shaded region is x(t) = 1, otherwise x(t) = 0. Parameters are λ1 = 0.11, λ0 = 0.1, and r0 = r1 = 0.03.

