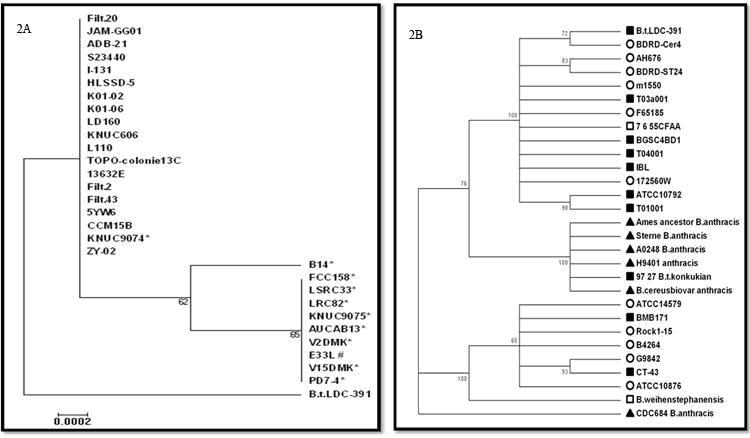
Figure 2.

A) Phylogram analysis using using Maximum likelihood for 16s rDNA sequence of B.t.LDC-391. *B.anthricis strains. #pathogenic B.cereus strain. Bootstrap values indicated at the nodes. Scale bar indicates no.of substittions per site; B) Phylogram analysis using UPGMA for cap gene sequence of B.t.LDC-391 along with representive strains from B.cereus group. B.cereus ungrouped bacillus B.thuringiensis, B.anthracis. Bootsrap values are indicated at the nodes of the phylogram
