
Figure 2.
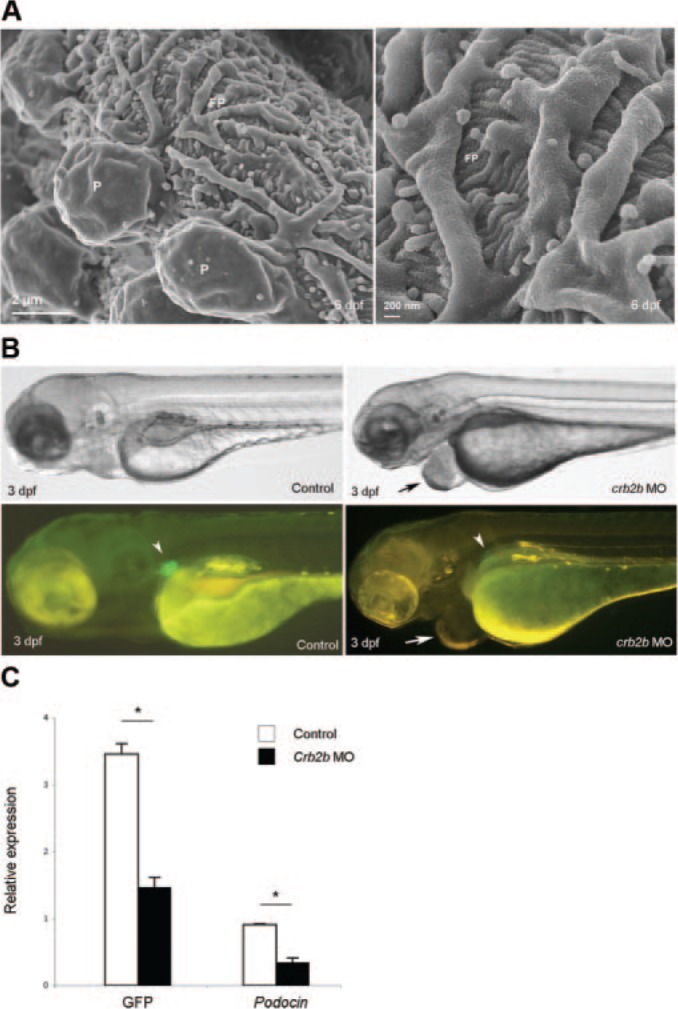
The Tg(podocin:GFP) line allows for ultrastructural studies and provides a direct readout for glomerular-specific phenotype in genetic studies. (A) Scanning electron micrograph of a 6-dpf glomerulus. Podocytes extend foot processes that interdigitate around capillary loops (left panel). The right panel shows branching foot processes at higher magnification. P, podocyte cell body; FP, primary (left panel) and interdigitating (right panel) foot processes. (B) Crb2b knockdown embryos. A crb2b morphant (right panel) shows a typical pericardial edema (arrow), coupled with loss of glomerular GFP signal (arrowhead), compared with the control (left panel). (C) Relative GFP and podocin mRNA levels in crb2b morphants (n = 5) and controls (n = 3) by determined by quantitative PCR. The error bars indicate the SD. *P < 0.01 (t test).